During the fourth quarter of 2015, the Seafarer Overseas Growth and Income Fund gained 1.08%.1 The Fund’s benchmark, the MSCI Emerging Markets Total Return Index, rose 0.73%. By way of broader comparison, the S&P 500 Index rose 7.04%.
The Fund began the quarter with a net asset value of $10.34 per share. During the quarter, the Fund paid a semi-annual distribution of approximately $0.081 per share. This payment brought the cumulative distribution, as measured from the Fund’s inception, to $1.172 per share.2 The Fund then finished the quarter with a value of $10.37 per share.3
During the calendar year, the Fund declined -4.18%, whereas the benchmark index fell -14.60%.4
[Please note: this portfolio review encompasses only the fourth quarter of 2015, and not the entire calendar year. The Fund operates on a fiscal year that concludes April 30; as such, Seafarer offers comprehensive portfolio reviews for its annual and semi-annual periods, which are published in the Fund’s Shareholder Reports in late June and December respectively. Previous Shareholder Reports are available in the Archives.]
Performance
Stocks throughout the emerging markets began the quarter by rebounding from the lows set during the third quarter. Between October 1 and November 4, the benchmark index rose 9.72%. There was no obvious reason for this gain except as a broad-based reaction to the -24.42% decline in the index that occurred between April 28 and September 30. Essentially, stocks reflexively recovered a portion of the value lost previously.
However, emerging equities were unable to sustain this partial recovery, particularly in the face of renewed concerns about the health of China’s economy. That country’s economy continues to exhibit signs that it is decelerating. While the fact of the deceleration should not have struck any careful observer as anything new or even particularly worrisome, it appears that certain investors were nonetheless caught by surprise. Such investors are apparently as distraught by the country’s slowing growth as they are by the realization that China’s government has been unwilling thus far to engage in any large-scale economic stimulus program that might offset the decline.
At quarter end, the Fund managed to outpace its benchmark index by only a slight margin. During the quarter, the Fund’s movements paralleled those of the broader index: it rose through October, declined sharply in November, and fell modestly in December. The Fund’s marginal outperformance was due to selected holdings in China, Japan, Indonesia and Turkey. Those holdings had no unifying theme or idea that could explain the basis for their performance during the quarter.
Allocation
Over the course of the quarter, the Fund continued to benefit from shareholder subscriptions. This influx of new capital allowed me to reposition the Fund structurally, in an efficient manner, such that I sold only one security along the way.
I have slowly but steadily reduced the Fund’s allocation to its Asian holdings, such that the Fund is now more “underweight” the Asian region than it has been since its inception, and it is more “overweight” Latin America and Eastern Europe (comprised of Poland and Turkey) than it has been since its inception. I have undertaken this shift because I believe the valuations afforded by the securities in the latter two regions are more attractive than the former, and because of growing uncertainty with respect to the Chinese economy (see my comments in the Outlook section below).
At the same time, I have emphasized the Fund’s holdings in larger capitalization securities (I define “large” as a security with an equity capitalization in excess of $10 billion at the time of measurement). I have done so because I believe the valuations associated with the Fund’s larger companies have grown considerably more attractive than those of the Fund’s smaller companies – even as I would argue the Fund’s smaller companies are still attractive in absolute, and warrant ongoing, if smaller, positions.
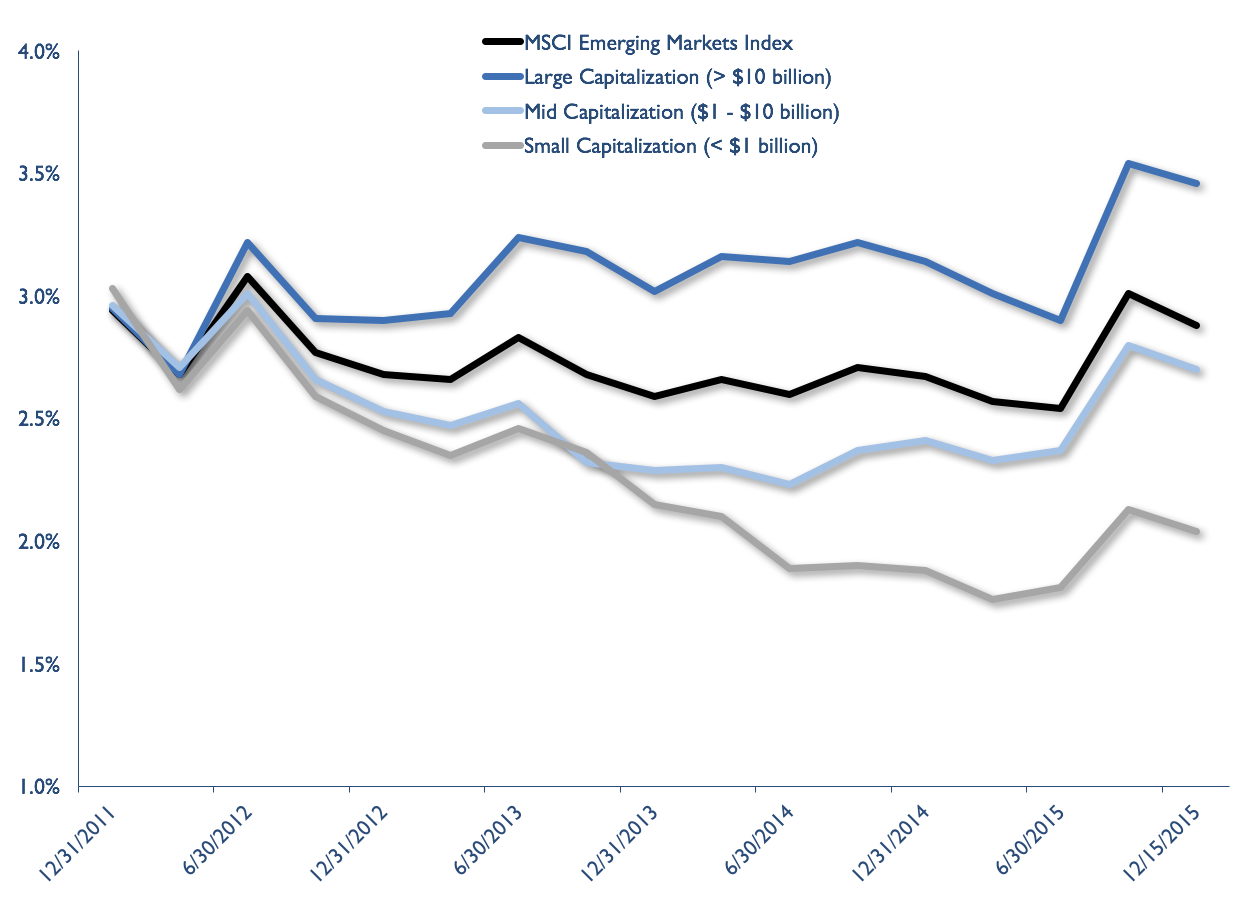
One way to depict the relative attractiveness of larger companies in emerging markets at present can be seen in Figure 1 below. In the figure, you will see the Fund’s benchmark, the MSCI Emerging Markets Index, depicted from a time near the Fund’s inception until the end of 2015. The figure does not depict the index’s performance since that time, but rather the average dividend yield associated with the index and its underlying holdings. The index is depicted in dark blue. I have also broken out its sub-components in separate lines, with larger companies (index holdings in excess of $10 billion equity capitalization), mid-sized companies (in excess of $1 billion, less than $10 billion), and smaller companies (below $1 billion).
- Sources: Bloomberg, MSCI, Seafarer.
- 30-Day SEC Yield: SFGIX 2.13%; SIGIX 2.18% (12/31/15)
Figure 1 aims to display the valuation characteristics associated with the various sub-components of the index. I have chosen to display dividend yields rather than price-to-earnings multiples or price-to-book multiples because I believe yields are the most useful metric when explaining valuation levels in aggregate. However, had I chosen nearly any other metric, the chart would tell much the same story.
At the inception of the chart, the four lines are converged. This suggests that near the time of the Fund’s launch, investors did not differentiate much between larger companies and smaller companies with respect to valuation, at least as measured by dividend yield. At the time, I found this odd; I was very concerned that the emerging markets might experience weak growth, far below prevailing expectations. Consequently, larger companies seemed overvalued: due to their size, the growth prospects of such companies were inevitably tied closely to their respective macro-economic environments, which appeared to be deteriorating.
I thought that smaller and mid-sized companies might offer more “secure” growth prospects at roughly equivalent valuations. The security stemmed from the idea that smaller and mid-sized companies might prove more nimble amid the deteriorating environment. I thought such companies might find means to grow in new niche markets, or perhaps by stealing market share from larger, less nimble companies. As I researched prospective holdings for the Fund’s initial portfolio, I found companies of all sizes that fit the Fund’s strategy. However, I placed particular weight on the smaller and mid-sized companies, informed in part by the preceding view.
With the benefit of hindsight, this decision proved beneficial to the Fund’s performance. During the ensuing four years, smaller and mid-sized companies outperformed, both within the Fund, and across the market as a whole. The disparity in performance is implied by the separation of the four lines in Figure 1 – as smaller capitalization stocks outperformed, their dividend yields were depressed; and as larger capitalization stocks cheapened, their dividend yields expanded.
At the present date, I believe that valuations of stocks within the Fund have shifted sufficiently that I have reversed the original allocation. You can see part of the background for that decision in Figure 1: larger stocks within the index offer, in aggregate, a 3.6% dividend yield, versus only 2.0% for smaller stocks. This is tantamount to a 70% yield “premium,” such that holding the index’s portfolio of larger stocks generates substantially more current income than its portfolio of smaller stocks. I believe the premium associated with larger stocks will prove advantageous, particularly as I also believe that there is scope for a modest re-acceleration in macroeconomic growth. I have accordingly shifted the portfolio toward larger stocks.
Three of the stocks that received additional capital as part of this shift (Hang Lung, Sanlam, and Bank Pekao) are deceptively small, and consequently I am forced to classify them as “mid-capitalization stocks.” All had capitalizations in excess $10 billion at the time they were added to the Fund. However, currency and stock price movements have dragged each across the $10 billion threshold I use to distinguish “the large” from “the mid.” Still, I consider these companies to be “large” in their respective industries, and I believe their capitalizations will eventually recover scale in excess of $10 billion.
Apart from the aforementioned structural shifts in the Fund’s composition, the Fund exited a single equity in favor of another. For the past few years, the Fund has held a position in Digital China, a company engaged in various software projects and the distribution of technology hardware in China. The company is arguably one of the leaders in its particular market niche; however, the deceleration of the Chinese economy, combined with intensifying competition, meant deteriorating profitability for the company.
The company responded to these challenges by undertaking a substantial corporate restructuring. The transaction culminated in the public listing of one of its key subsidiaries in the A-share market of mainland China. Digital China’s management believed this restructuring would reveal much of the value latent in the company’s balance sheet, and I thought much the same.
However, while the company’s stock surged at first, the market ultimately rejected the maneuver, and the shares quickly surrendered all their gains. Meanwhile, the restructuring meant that Digital China had become more of a financial holding company than an operating company – from my point of view, the most vital operations had been spun off into the newly-listed A-share company – and thus Digital China’s operating earnings were increasingly erratic and anemic. The deterioration in the company’s ongoing profitability triggered the search for a new position, even as I would maintain that Digital China’s shares exhibit attractive, balance sheet-driven value today.
As I considered dismissing Digital China from the portfolio, I sought a replacement that would serve as an upgrade to the outgoing position. The Seafarer team researched a number of stocks across a variety of industries around the world. In the end, I replaced Digital China with another software company, but this time located in Brazil; it is called TOTVS. The company is one of Brazil’s largest purveyors of “enterprise resource planning” software, which helps small and medium-sized companies keep track of accounts, capital and people so as to better budget resources and to manage profitability.
The team has followed TOTVS for several years, but its valuation was sufficiently high as to make it unattractive to establish a position. However, after a recent correction, the valuation of the company is much improved. It is, almost assuredly, more expensive when placed side-by-side with Digital China. However, TOTVS’ business model and past financial history suggest that it enjoys cash flows that are far more stable; and its growth potential also appears far more sustainable. In this manner, the new position represents an “upgrade” to the old one in terms of both prospective growth and earnings quality. This switch, from Digital China to TOTVS, illustrates our aim at Seafarer: to make gradual, marginal “upgrades” to the portfolio’s long-term allocation of capital.
Outlook
Given the movement of markets in January, everyone in the world would like to know: what is going on in China? I wish I knew with certainty. Unfortunately, the situation is sufficiently opaque that facts are scant, and thus I can only speculate as to the cause behind the A-share market’s sudden collapse.
The dominant explanation of events propagated by the financial media is that the sharp downturn in Chinese equities was spurred by a decline in the value of the Renminbi (the local Chinese currency) versus the dollar. Supposedly the Renminbi’s weakness in 2016 has spooked domestic Chinese investors such that they retreated rapidly from stocks, sold at great losses, and sent shares spiraling lower.
Personally, I find this explanation deficient because it lacks any sense of proportionality. During the first week of the new year, the Renminbi weakened versus the dollar, but only by 1.9% (and it subsequently recovered this loss).5 Meanwhile, by the end of January, the domestic A-share market saw its capitalization shrink by $1.7 trillion (roughly 27%).6 How could a trivial and short-lived depreciation of the currency – a decline hardly distinguishable from routine “market noise” – explain a $1.7 trillion implosion in the stock market? Frankly, I do not buy it; the media’s explanation lacks any sense of proportion – and it is far too simplistic – to serve as a reasonable explanation of cause and effect.
Some pundits have suggested that new reports of weakness in the Chinese economy might explain the market’s rapid decline. Certainly, recently published data suggests weakness; but the deceleration within the economy should be well understood by now, and none of the new data is sufficiently disturbing as to spur the abrupt sell-off.
Unfortunately, I can only speculate as to the actual cause of the decline, so my thoughts on the matter are frankly no better than the media’s. I have very few facts to substantiate my arguments; all I can do is look at the pattern of events that has unfolded, and speculate as to the causes. At this time, I would suggest two possible scenarios that might have caused the sell-off:
- The Renminbi’s weakness is not the direct cause of the decline, but it is a precursor for a growing liquidity shortage within the Chinese financial system. The currency’s persistent weakness may indicate that one or more banks, or perhaps some portion of the shadow banking system, may soon experience a liquidity crisis. This explanation would suggest the currency is signaling stressed liquidity within the financial system, to which stocks have reacted swiftly and punitively.
- Political discord has undermined financial confidence. Over the past three years, the current administration has propagated a sweeping anti-corruption campaign that has at times terminated in controversial political purges. The government has also introduced bold economic reforms – reforms that I largely support – that have undoubtedly alienated powerful vested interests. Meanwhile, the administration has sought to consolidate power in a manner not seen, arguably, since Mao’s era. It might be that such dramatic actions have quietly eroded a measure of support for the administration among powerful factions within the Communist party. If so, the recent weakness in the currency and the stock market might reflect this discord.
Either scenario might have been the root cause of the volatility we observed; it is also possible that both acted in tandem. Still, I cannot offer much evidence to substantiate either scenario, and thus both are only conjecture. Yet if neither scenario holds truth, I am at a loss to explain why the Chinese stocks behaved in the erratic and volatile manner they did. I do not see any new facts in the public domain that could plausibly explain such events.
Obviously, if evidence emerges in support of either hypothetical scenario, it will be cause for concern. At this juncture, I think the facts in the public domain are too sparse as to warrant any drastic change in the Fund’s portfolio, or even for investors to reorient their strategic allocations more broadly. However, at a time of such uncertainty, I suggest investors monitor events in China with great attention, as we will do at Seafarer. For the past year or so, out of concern for these two events, the Fund has been especially selective regarding all Chinese investments. As mentioned above, the Fund’s allocation to the Asia region is near an all-time low since its February 2012 inception.
There are at least two points that serve as strong counterbalance against potentially adverse conditions in China. They are:
- As noted above, I am reasonably certain that valuations in the emerging markets for large capitalization stocks are quite favorable when measured in aggregate – with the caveat that, as always, there are individual stocks and entire markets that are outliers with respect to what one might consider “cheap” or “expensive.”
- There is ample evidence that the interest rate policies of the emerging markets have diverged from those of the U.S. Even as the U.S. Federal Reserve has recently raised rates, the majority of central banks in the developing world are cutting rates or keeping them stable, and perhaps have room to cut further. It is this divergence in monetary policies that I believe caused the severe weakness in emerging market currencies over the past few years (obviously, a substantial negative from a dollar investor’s point of view). However, I believe this divergence may also allow for relatively relaxed monetary conditions (i.e. low domestic interest rates) that might promote a modest recovery in nominal economic growth and corporate earnings. If so, the anemic conditions that have characterized the emerging markets for past five years might finally be at an end – and that would constitute a positive change from a dollar investor’s point of view.
Thank you for entrusting us with your capital. We are honored to serve as your investment adviser in the developing world.
Andrew Foster,- The performance data quoted represents past performance and does not guarantee future results. Future returns may be lower or higher. The investment return and principal value will fluctuate so that an investor's shares, when redeemed, may be worth more or less than the original cost. View the Fund’s most recent month-end performance.
- The MSCI Emerging Markets Total Return Index, Standard (Large+Mid Cap) Core, Gross (dividends reinvested), USD is a free float-adjusted market capitalization index designed to measure equity market performance of emerging markets. Index code: GDUEEGF. It is not possible to invest directly in this or any index.
- The S&P 500 Total Return Index is a stock market index based on the market capitalizations of 500 large companies with common stock listed on the NYSE or NASDAQ. It is not possible to invest directly in this or any index.
- The views and information discussed in this commentary are as of the date of publication, are subject to change, and may not reflect the writer's current views. The views expressed represent an assessment of market conditions at a specific point in time, are opinions only and should not be relied upon as investment advice regarding a particular investment or markets in general. Such information does not constitute a recommendation to buy or sell specific securities or investment vehicles. It should not be assumed that any investment will be profitable or will equal the performance of the portfolios or any securities or any sectors mentioned herein. The subject matter contained herein has been derived from several sources believed to be reliable and accurate at the time of compilation. Seafarer does not accept any liability for losses either direct or consequential caused by the use of this information.
- As of December 31, 2015, Hang Lung Properties, Ltd. comprised 4.2% of the Seafarer Overseas Growth and Income Fund, Sanlam, Ltd. comprised 4.1% of the Fund, Bank Pekao SA comprised 4.6% of the Fund, and TOTVS SA comprised 2.6% of the Fund. The Fund had no economic interest in Digital China Holdings, Ltd. View the Fund’s Top 10 Holdings. Holdings are subject to change.
- References to the “Fund” pertain to the Fund’s Institutional share class (ticker: SIGIX). The Investor share class (ticker: SFGIX) gained 1.03% during the quarter.
- The Fund’s inception date is February 15, 2012.
- The Fund’s Investor share class began the quarter with a net asset value of $10.32 per share; it paid a semi-annual distribution of approximately $0.076 per share in December; and it finished the quarter with a value of $10.35 per share.
- The Fund’s Investor share class declined -4.32% during the calendar year.
- Sources: Bloomberg, Seafarer.
- Sources: Bloomberg, Seafarer.
![[Chrome]](/_layout/images/ua/chrome.png)
![[Firefox]](/_layout/images/ua/firefox.png)
![[Opera]](/_layout/images/ua/opera.png)
![[Microsoft Edge]](/_layout/images/ua/edge.png)