- The “Shanghai-Hong Kong Stock Connect” program, colloquially known as the “through train,” allows foreign investors to purchase selected Chinese A-shares regardless of their QFII (Qualified Foreign Institutional Investor) status. State-owned enterprises (SOEs) represent the majority of the A-share market capitalization. SOEs tend to earn lower returns than private sector companies.
- Against this general background, I found a wide spectrum of SOEs: from those that gained market share and productivity over time, to those with relatively passive management, and others enjoying extraordinary returns in sectors with limited competition.
- Some of my screening efforts isolated a subset of SOEs that generate above-average ROAs (return on assets), with rising dividends, and growing excess cash in the balance sheet.
- Based on conversations with various management teams, I conclude that there is latent investment capacity within the wide spectrum of Chinese SOEs. Importantly, these investments could be financed with internal balance sheets instead of debt, and would probably yield higher-than-historical returns given a newfound focus on productivity within the Chinese state sector.
Following my recent trip to Hong Kong and report on the student protests there, I traveled to the mainland with the express purpose of meeting companies listed as A-shares on the Shanghai Stock Exchange. My objective was to search for investment ideas in anticipation of the inauguration of the Shanghai-Hong Kong Stock Connect program, which subsequently launched on November 16, 2014.
The Stock Connect program provides foreign investors access to a set of mainland companies listed as A-shares in Shanghai and Shenzhen. A-shares were previously only accessible to holders of a QFII (Qualified Foreign Institutional Investor) license.
The process of finding investment ideas the old-fashioned way – by conducting bottom-up research and meeting management teams one company at a time – was daunting. State owned enterprises (SOEs) account for approximately 60% of the A-share market; yet they are generally understood to be far less profitable and less efficient in allocating capital than their private sector peers. My challenge was to find underappreciated value in this landscape, not simply companies trading cheaply for a reason.
True to form, China surprised by revealing a reality more complex than initial expectations. Not only are Chinese SOEs more diverse than the monochrome tone that Wall Street uses to paint the picture of this sector, but our bottom-up research revealed an underappreciated dimension of the oft-cited slowdown in Chinese gross domestic product (GDP) growth.
I found four broad categories of SOEs:
- Companies of modest origins that have grown not only in scale, but in profitability and capacity for internally-driven innovation as well. While the state remains the controlling shareholder, management seems empowered with an above-average degree of autonomy in making decisions.
- SOEs with competent management and reasonable financial performance that lack control over the major decisions impacting their long-term future. These decisions tend to relate to capital allocation.
- Corporates that have grown in scale tracking Chinese GDP, not necessarily due to management skill. These companies tend to simply await instructions from the State-owned Assets Supervision and Administration Commission (SASAC). There was a palpable difference in the energy management of these companies conveyed during our meetings, relative to the SOEs cited above.
- Very profitable SOEs that derive abnormal returns from an asset that is not capitalized in the balance sheet. These tend to be companies that operate in protected sectors. As a result there is no impetus for change or dynamism, but the businesses remain highly profitable nevertheless.
The spectrum of companies listed above represents an ideal hunting ground for investment prospects. Yet, most commentary on the subject of SOEs tends to revolve around a single idea presented in Figure 1: Chinese SOEs Lag Non-SOEs in Return on Assets.
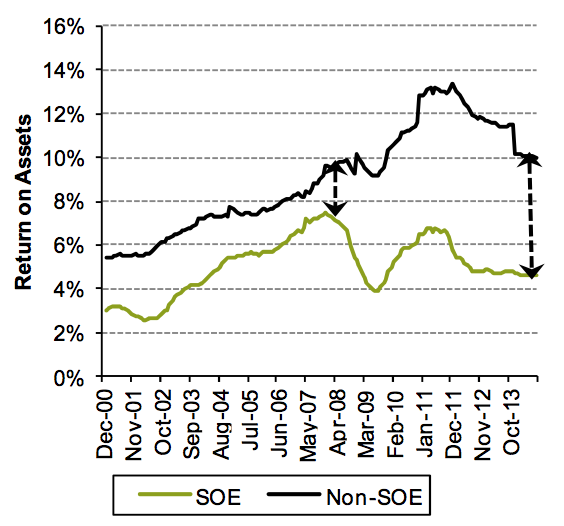
- Source: Neil Beveridge, et al., “China 2015, SOE Reform Part 1: SOE Bad, But Can They Become SOE Good,” Bernstein Research, 10 November 2014.
As Figure 1 suggests, return on assets (an indicator that simultaneously conveys productivity and profitability) is structurally lower among the SOEs than it is among non-SOEs (private sector companies) in China. This finding is not terribly surprising given the incentive structure at most SOEs: most have been managed for the collective benefit of the centrally-planned economy, rather than to produce profit. However, what I did not expect to find is the following contrasting data from the aggregated figures of the SOEs I visited.
The charts that follow below are not based on a representative sample of SOEs in China, but rather a small subset that I researched in greater depth. To find these companies, I screened for a group that consistently generated positive free cash flow, had healthy balance sheets, and had a market capitalization in excess of $250 million. These charts depict the aggregated data for eleven such SOEs, all of which I visited in person. Please note that the data in these charts, being based on a small subset of the SOE universe, may differ considerably from the broader universe of SOEs that is captured in national statistical data. Henceforth, I will refer to this group of companies as the “Seafarer SOE Universe.”
The following chart, Figure 2: Return on Assets for the Seafarer SOE Universe, illustrates that not all SOEs are created equal. Note the higher return on assets (ROA) for the Seafarer SOE Universe, as shown in the blue bars, versus the national average in Figure 1 above. Notice as well that once we exclude the excess cash in the balance sheet of these companies, the ROA rises significantly, as shown in the orange bars. Seafarer defines excess cash as that above the level required to run the business.
- Sources: Seafarer, Bloomberg.
The charts below, Figure 3: Excess Cash for the Seafarer SOE Universe and Figure 4: Net Debt / Assets for the Seafarer SOE Universe, explain the sizable difference between ROA and ROA ex-excess cash. The Seafarer SOE Universe generates cash and has substantial holdings of cash (net of any debt), suggesting in aggregate, its balance sheet is conservatively deployed.
- Sources: Seafarer, Bloomberg.
- Sources: Seafarer, Bloomberg.
One of the principal objectives of SOEs is to generate tax revenue for the provincial and central governments. Yet, it should be noted that dividends have grown faster than tax payments since 2010. While SASAC is one of the main beneficiaries of this change, so are minority shareholders. Thus, even though SASAC is acting in its own self-interest, it does represent an important step forward in the direction of adding value to shareholders. Tax and dividend payments for the Seafarer SOE Universe are shown in Figure 5.
- Sources: Seafarer, Bloomberg.
Finally, excess cash residing in the balance sheet of this sample of SOEs is as significant as that paid to the government and shareholders over the past 13 years. See Figure 6: Cumulative Tax + Dividends Versus Excess Cash for the Seafarer SOE Universe.
- Sources: Seafarer, Bloomberg.
One of the common threads among the meetings I held was the expectation by many companies that SASAC would make strategic decisions regarding their future sometime in the beginning of 2015. In my view, it is probably not a coincidence that SASAC is making these decisions now that the anti-corruption campaign seems to be past its apex. In essence, the change of government between 2010 and 2012, followed by the anti-corruption campaign of the past two years, seems to have delayed many decisions in China, including those related to asset restructurings and capital expenditures. I suspect that China is preparing to unleash the balance sheet of a segment of SOEs represented by the graphs above. For example, of the companies I visited, two of them had invested less in capital expenditure than their depreciation charge over the past two years. Far from being a sign of lower investment in a decelerating economy, the low capital expenditure reflected the suspension of decision making by SASAC. Indeed, these two companies had already made preparations for a very significant expansion of their asset base, and were simply waiting for the green light to proceed.
My meetings with companies provided an important perspective on the recent deceleration of growth within China. Not only did the meetings point to the possibility of latent investment capacity, but also – and more importantly – they indicated the possibility that new investment would be funded by prior production, not newly minted debt.
Furthermore, more than one management team mentioned new KPIs (Key Performance Indicators) in personnel evaluations. The words “commercial considerations, not just administrative ones” came up in another conversation. In other words, SASAC is concerned with productivity. Thus, I suspect that there is a significant probability of SOEs not only funding a new wave of capital expenditures with internal balance sheets; but it is also likely this investment will yield improved long-term returns relative to the debt-funded capital expenditure cycle in China that followed the 2008 global financial crisis.
Finally, the last area of potentially significant change for SOEs is stock compensation for employees. The feedback I received on this topic ranged from emphatic denial to acknowledgement that the issue had been discussed among employees.
Potential stock compensation for employees in future years is significant because one of China’s defining characteristics over decades has been the role of SASAC in retaining and allocating corporate profits. This dynamic started to change in recent years with wages growing ahead of corporate profits and GDP. The problem with this change from a shareholder’s perspective is that it came at the same time as other pressures on corporate profitability (appreciation in the local currency, the renminbi, and slowing external revenue growth); thus partially explaining the underperformance of Chinese equities during recent years.
Potentially incentivizing management with stock would represent a significant leap forward because it would change the dynamic from a zero-sum game as described above, to one where a company’s growing productivity would finance incremental employee compensation. In other words, the upcoming round of SOE reform and balance sheet deployment should represent a more self-reinforcing dynamic than growth based on simple debt-financed expenditure. Not only would this type of latent growth in China prove more sustainable, but eventually SOE employees would share in that growth for the first time.
Paul Espinosa


- The characteristics of the group of companies referred to as the “Seafarer SOE Universe” in this commentary are not necessarily indicative of the characteristics or performance of the Seafarer Overseas Growth and Income Fund.
- The views and information discussed in this commentary are as of the date of publication, are subject to change, and may not reflect the writer’s current views. The views expressed represent an assessment of market conditions at a specific point in time, are opinions only and should not be relied upon as investment advice regarding a particular investment or markets in general. Such information does not constitute a recommendation to buy or sell specific securities or investment vehicles. It should not be assumed that any investment will be profitable or will equal the performance of the portfolios or any securities or any sectors mentioned herein. The subject matter contained herein has been derived from several sources believed to be reliable and accurate at the time of compilation. Seafarer does not accept any liability for losses either direct or consequential caused by the use of this information.