Overview
Investment Objective
The Fund seeks to provide long-term capital appreciation.
Strategy
The Fund invests primarily in the securities of companies located in developing countries. The Fund invests in several asset classes including common stocks, preferred stocks, and fixed-income securities.
The Fund’s portfolio is comprised of securities identified through a bottom-up security selection process based on fundamental research. The Fund seeks to produce a minimum long-term rate of return by investing in securities priced at a discount to their intrinsic value.
Sources of Value
Seafarer has identified seven distinct sources of value in emerging markets that may give rise to viable opportunities for long-term, value-oriented investments.
| Opportunity Set | Source of Value | |
|---|---|---|
| Balance Sheet | Balance Sheet Liquidity | Cash or highly liquid assets undervalued by the market |
| Breakup Value | Assets whose liquidation value exceeds their market capitalization | |
| Management Change | Assets expected to become more productive under a new owner or management due to changes in operations or capital allocation that enhance shareholder value | |
| Deleveraging | Shift of cash flow accrual from debt holders to equity holders | |
| Asset Productivity | Assets expected to become more productive due to changes in industry or company-specific cycles | |
| Structural Shift | Cash generative companies experiencing a shift in structural growth | |
| Income Statement / Cash Flow | Segregated Market | Productive assets trading in a less liquid public market or otherwise segregated from the mainstream of capital flows |
- Additional information is available in the white paper On Value in the Emerging Markets.
Fund Characteristics
Portfolio Management
| Paul Espinosa | Lead Manager |
| Brent Clayton | Co-Manager |
| Andrew Foster | Co-Manager |
A Value Approach to Emerging Markets
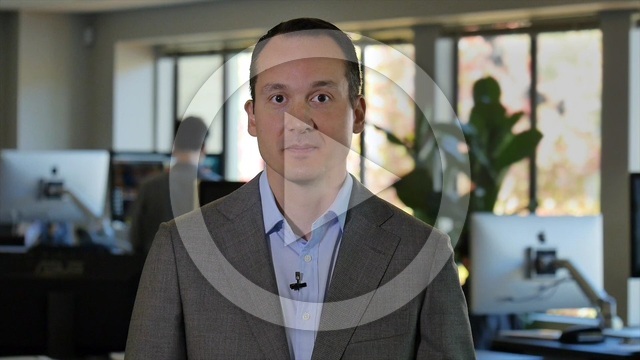
Paul Espinosa describes the structural changes that have made it possible to realize a value strategy in emerging markets. He explains how the strategy’s research process is based on Seafarer’s framework of seven distinct sources of value in emerging markets.
MoreUnderlying Portfolio Holdings
| Holdings | |
| % of Net Assets in Top 10 Holdings | |
| Weighted Average Market Cap | |
| Market Cap of Portfolio Median Dollar | |
| Gross Investment Portfolio Yield4 | |
| Price / Book Value4 | |
| Price / Earnings46 | |
| Earnings Per Share Growth45 |
- Gross expense ratio: 1
- The performance data quoted represents past performance and does not guarantee future results. Future returns may be lower or higher. The investment return and principal value will fluctuate so that an investor’s shares, when redeemed, may be worth more or less than the original cost. View the Fund’s most recent month-end performance.
Geographic Focus
Developing countries and territories including, but not limited to:
| Africa | Botswana, Ghana, Kenya, Mauritius, Morocco, Nigeria, Tunisia, South Africa, Zimbabwe |
| East and South Asia | Bangladesh, China, India, Indonesia, Malaysia, Pakistan, Philippines, South Korea, Sri Lanka, Taiwan, Thailand, Vietnam |
| Emerging Europe | Bosnia and Herzegovina, Bulgaria, Croatia, Czech Republic, Estonia, Georgia, Greece, Hungary, Lithuania, Kazakhstan, Poland, Romania, Russia, Serbia, Slovenia, Turkey, Ukraine |
| Latin America | Argentina, Brazil, Chile, Colombia, Jamaica, Mexico, Peru, Trinidad and Tobago |
| Middle East | Bahrain, Egypt, Jordan, Kuwait, Lebanon, Oman, Qatar, Saudi Arabia, United Arab Emirates |
Select developed countries and territories with significant economic and financial linkages to developing countries, including, but not limited to, Australia, Hong Kong, Ireland, Israel, Japan, New Zealand, Singapore, and the United Kingdom.
- Sources: ALPS Fund Services, Inc., Bloomberg, Morningstar, Seafarer.
- Portfolio holdings are subject to change.
- Seafarer Capital Partners, LLC has agreed contractually to waive and/or reimburse fees or expenses in order to limit Total Annual Fund Operating Expenses After Fee Waiver / Expense Reimbursements (inclusive of acquired fund fees and expenses, and exclusive of brokerage expenses, interest expenses, taxes and extraordinary expenses) to 1.05%, 1.15%, and 1.35% of the Fund’s average daily net assets for the Institutional, Investor, and Retail share classes, respectively. This agreement shall continue at least through August 31, 2026.
- The 12b-1 Fee is included in the Gross Expense Ratio for SFVRX.
- Shareholders who sign up for an Automatic Investment Plan can request a waiver of the Institutional Class investment minimum. View the waiver program criteria.
- Calculated as a harmonic average of the underlying portfolio holdings.
- Based on consensus earnings estimates for next year. Excludes securities for which consensus earnings estimates are not available.
- © Morningstar, Inc. All rights reserved. The Active Share data is proprietary to Morningstar and/or its content providers; may not be copied or distributed; and is not warranted to be accurate, complete, or timely. Neither Morningstar nor its content providers are responsible for any damages or losses arising from any use of this information. Past performance is no guarantee of future results.
Performance
Total Returns
As of (Prior Month)
| 43 | NAV / Index Level () | Annualized | Cumulative | Inception Date | Net Expense Ratio2 | Gross Expense Ratio2 | ||||||||
|---|---|---|---|---|---|---|---|---|---|---|---|---|---|---|
| YTD | 1 Mo | 3 Mo | 1 Yr | 3 Yr | 5 Yr | 7 Yr | 10 Yr | Since Inception1 | Since Inception1 | |||||
- Gross expense ratio: 2
As of (Prior Quarter)
| 43 | NAV / Index Level () | Annualized | Cumulative | Inception Date | Net Expense Ratio2 | Gross Expense Ratio2 | ||||||||
|---|---|---|---|---|---|---|---|---|---|---|---|---|---|---|
| YTD | 1 Mo | 3 Mo | 1 Yr | 3 Yr | 5 Yr | 7 Yr | 10 Yr | Since Inception1 | Since Inception1 | |||||
- Gross expense ratio: 2

- The rates of return are hypothetical and do not represent the returns of any particular investment.
- Fund performance is presented in U.S. dollar terms, with U.S. jurisdiction distributions reinvested on a gross (pre-tax) basis. For the Bloomberg and Morningstar indices, performance is calculated to reflect the reinvestment of dividends, capital gains, and other corporate actions net of foreign jurisdiction withholding taxes. The performance data quoted represents past performance and does not guarantee future results. Future returns may be lower or higher. The investment return and principal value will fluctuate so that an investor's shares, when redeemed, may be worth more or less than the original cost.
- Source: ALPS Fund Services, Inc.
Return Characteristics as of
Relative to the Bloomberg Emerging Markets Large, Mid, and Small Cap Net Return USD Index except where noted.
| 3 years | Since Inception5 | |
|---|---|---|
| Alpha | ||
| Beta | ||
| R-squared | ||
| R-squared vs. S&P 500 Index | ||
| Upside Capture Ratio | ||
| Downside Capture Ratio |
- Source: Morningstar.6
- “Since Inception” returns for the Bloomberg and Morningstar indices are as of the inception date of the Fund’s Institutional and Investor share classes.
- Seafarer Capital Partners, LLC has agreed contractually to waive and/or reimburse fees or expenses in order to limit Total Annual Fund Operating Expenses After Fee Waiver / Expense Reimbursements (inclusive of acquired fund fees and expenses, and exclusive of brokerage expenses, interest expenses, taxes and extraordinary expenses) to 1.05%, 1.15%, and 1.35% of the Fund’s average daily net assets for the Institutional, Investor, and Retail share classes, respectively. This agreement shall continue at least through August 31, 2026.
- Source: Bloomberg Index Services Limited. BLOOMBERG® is a trademark and service mark of Bloomberg Finance L.P. and its affiliates (collectively “Bloomberg”). Bloomberg or Bloomberg’s licensors own all proprietary rights in the Bloomberg Indices. Neither Bloomberg nor Bloomberg’s licensors approves or endorses this material, or guarantees the accuracy or completeness of any information herein, or makes any warranty, express or implied, as to the results to be obtained therefrom and, to the maximum extent allowed by law, neither shall have any liability or responsibility for injury or damages arising in connection therewith.
- The Seafarer Funds are not sponsored, endorsed, sold, or promoted by Morningstar, Inc. Morningstar, Inc. makes no representation or warranty, express or implied, to the shareholders of the Funds or any member of the public regarding the advisability of investing in the Funds or the ability of the Morningstar Emerging Markets Net Return U.S. Dollar Index to track general equity market performance of emerging markets.
- As of 5/31/16.
- © Morningstar, Inc. All rights reserved. The data in the Return Characteristics table is proprietary to Morningstar and/or its content providers; may not be copied or distributed; and is not warranted to be accurate, complete, or timely. Neither Morningstar nor its content providers are responsible for any damages or losses arising from any use of this information. Past performance is no guarantee of future results.
Composition
Top 10 Holdings as of
| Holding | Sector | Country | Issuer Mkt Cap ($B) | Yield1 | Price/ Book | Price/ Earnings23 | EPS Growth2345 |
|---|
- Portfolio holdings are subject to change.
- Sources: ALPS Fund Services, Inc., Bloomberg, Seafarer.
Portfolio Composition by Region as of
| All Holdings | ADRs, Common & Preferred Equities Only | ||||||||||
|---|---|---|---|---|---|---|---|---|---|---|---|
| % Net Assets | Price / Earnings67 | EPS Growth67 | |||||||||
| Region | # of Holdings | Fund | +/− vs. Index | Avg Mkt Cap ($B) | Gross Yield6 | Price / Book6 | Prior Year | This Year | Next Year | This Year | Next Year |
- Sources: ALPS Fund Services, Inc., Bloomberg, Seafarer.
Portfolio Composition by Sector as of
| All Holdings | ADRs, Common & Preferred Equities Only | ||||||||||
|---|---|---|---|---|---|---|---|---|---|---|---|
| % Net Assets | Price / Earnings67 | EPS Growth67 | |||||||||
| Sector | # of Holdings | Fund | +/− vs. Index | Avg Mkt Cap ($B) | Gross Yield6 | Price / Book6 | Prior Year | This Year | Next Year | This Year | Next Year |
- Sources: ALPS Fund Services, Inc., Bloomberg, Seafarer.
- 30-Day SEC Yield: ()
- The performance data quoted represents past performance and does not guarantee future results. Future returns may be lower or higher. The investment return and principal value will fluctuate so that an investor’s shares, when redeemed, may be worth more or less than the original cost. View the Fund’s most recent month-end performance.
Portfolio Composition by Asset Class as of
| Asset Class | # of Holdings | % Net Assets |
|---|
- Source: ALPS Fund Services, Inc.
Portfolio Composition by Market Capitalization as of
| Market Capitalization | # of Holdings | % Net Assets | +/− vs. Index |
|---|
- Source: ALPS Fund Services, Inc.
- Due to rounding, percentage values may not sum to 100%. Values less than 0.5% may be rounded to 0%.
- Yield = dividend yield for common and preferred stocks and yield to maturity for bonds.
- Based on consensus earnings estimates for next year.
- Consensus estimates for earnings and EPS growth are not available for this security.
- Consensus EPS Growth forecasts (produced by research arms of investment banks) suggest that this company's earnings will improve, leading to substantial percentage growth in profits; however, such consensus forecasts are subject to a very high degree of uncertainty.
- As of April 2026, Bradsaude S A is the new name of the company formerly known as Odontoprev SA.
- Calculated as a harmonic average of the underlying portfolio holdings.
- Based on consensus earnings estimates. Excludes securities for which consensus earnings estimates are not available.
Distributions
For More Information
Individual Investors
- (855) 732-9220 (Mon–Fri 9am–8pm ET)
- seafarerfunds@alpsinc.com
Investment Professionals
- (415) 578-5809 (Mon–Fri 9am–8pm ET)
- Send a Message
2026 Distribution Dates
Distribution frequency: Annual
Please note: future dates are subject to change.
| Ex, Pay and |
||
|---|---|---|
| Year-end Distribution |
To be notified of distribution estimates, sign up for Seafarer email updates.
Historical Distributions
| Ex, Pay and | Reinvest | Ordinary | Short Term | Long Term | Total Distrib. | Cumulative Distrib. |
|---|---|---|---|---|---|---|
| SIVLX (Institutional Class) | ||||||
| SFVLX (Investor Class) | ||||||
| SFVRX (Retail Class) | ||||||
For more information on the Fund’s distribution policies, please see the “Dividends and Distributions” section of the Prospectus.
Foreign Source Income
The Seafarer Overseas Value Fund has elected to pass through to shareholders the foreign taxes paid on income earned from foreign investments. These foreign taxes are reported in Box 7 of Form 1099-DIV. As a shareholder in the Fund, you may be able to claim a tax credit or an itemized deduction on your federal tax return for the amount of taxes paid to foreign countries. Please consult your tax adviser.
| Year | Foreign Source Income |
|---|---|
- Past performance is no guarantee of future results. There is no guarantee that the Fund will pay or continue to pay distributions.
Portfolio Review
Portfolio Review – First Quarter 2026
During the first quarter of 2026, the Seafarer Overseas Value Fund returned 3.00%.12 The Fund’s benchmark indices, the Bloomberg Emerging Markets Large, Mid, and Small Cap Net Return USD Index and the Morningstar Emerging Markets Net Return USD Index, returned -0.54% and -0.40%, respectively. By way of broader comparison, the S&P 500 Index returned -4.33%.
The Fund began the quarter with a net asset value of $16.98 per share. It paid no distributions during the quarter and finished the period with a value of $17.49 per share.3
Performance
The full period returns of the Value Fund and its benchmarks during the quarter belie the volatility that unfolded within it. From December 31, 2025 through February 27, 2026, the last trading day before the U.S. and Israeli strikes on Iran, the Fund returned 15.37% while the Bloomberg Emerging Markets benchmark returned 12.98%. The outbreak of war brought the rally to a sudden end. The Fund fell -10.72% from February 27, 2026 through March 31, 2026 while the Bloomberg EM benchmark declined -11.97%. As one might have expected, Middle Eastern stocks contributed to the reversal of performance. However, the largest performance detractors after February 28 came from Asia where the risk of a prolonged closure of the Strait of Hormuz, a chokepoint for global seaborne oil and gas exports, weighed on sentiment in markets including South Korea, China, India, and, for the benchmarks, Taiwan.
The Fund’s relative outperformance versus its benchmarks in the quarter came despite its larger weighting to companies based in the Middle East region. Indeed, there was more to the Fund’s performance in the quarter than just the conflict, even if it dominated headlines and headspace. However, I will begin with the conflict’s most prominent impacts on performance.
As noted in Seafarer’s Message to Shareholders on March 3, 2026, the Value Fund had five holdings, representing 10.6% of net assets as of February 25, 2026, with material business interests in the Middle East region that might be financially or physically harmed by the conflict. Collectively, these holdings detracted less than -1% from the Fund’s quarterly performance. Four of the five holdings had negative performance for the quarter, ranging from -5.29% to -16.73% in U.S. dollar terms. Their negative returns likely reflected increased risk premia from the war related to the physical risks to their asset bases, potential financial impacts on energy exports through the Strait of Hormuz, and, for those catering to the domestic economy in the United Arab Emirates (UAE), greater uncertainty over the country’s trajectory of population growth. Cutting against the grain, one holding was up 28.39% in U.S. dollar terms over this quarterly period: Fertiglobe (Asset Productivity and Segregated Market; the “source of value” for a Fund holding is hereafter referenced in parentheses), a fertilizer manufacturer and exporter headquartered and listed in Abu Dhabi with production facilities in the UAE, Egypt, and Algeria. While exports from its UAE facilities look to be hampered by the closure of the Strait of Hormuz, its Egyptian and Algerian facilities stand to benefit from the jump in urea and ammonia prices caused by this very closure.
While risks to global energy supplies from the closure of the Strait of Hormuz are far-reaching, it is worth noting the direct negative operational impact it has had on Petronet LNG (Asset Productivity), an India-based importer of liquified natural gas (LNG), which fell -16.67% during the quarter in U.S. dollar terms. Much of the company’s LNG imports are from Qatar and pass through the Strait of Hormuz. Following a declaration of force majeure by Qatar Energy (Qatar’s state-owned energy company and the world’s largest LNG producer) in early March, Petronet declared force majeure with its own LNG buyers. The company does have net cash on its balance sheet, which may provide a liquidity buffer for a potentially prolonged closure scenario.
By contrast, PetroVietnam Technical Services (Management Change and Asset Productivity), a Vietnamese oil services company, is a likely beneficiary from the closure of the Strait. It rose 19.02% during the quarter in U.S. dollar terms. Higher energy prices and concerns about supply availability may encourage Vietnam to invest more in offshore hydrocarbon exploration and development, which could drive demand for its services.
From a geographic standpoint, India was the Fund’s largest source of negative returns during the quarter. Concerns over the country’s dependency on energy imports and a weakening Indian rupee hampered market sentiment. The Fund’s two largest detractors from performance during the quarter were Indian companies that had their own company-specific developments on top of the broad-based market downturn. UPL, Ltd. (Asset Productivity and Breakup Value), an India-based multinational agricultural chemicals company, was the Fund’s worst performing holding in the quarter, returning -31.94% in U.S. dollar terms. The company’s shares declined sharply after it announced a restructuring plan to spin out its global crop protection operations into a new listed entity. The company is also planning an IPO for its global seeds business. While the company’s stated intention was to unlock the intrinsic value of these subsidiaries, the market viewed things differently – perhaps pricing in an expected holding company discount. HDFC Bank (Asset Productivity and Structural Shift), India’s largest private sector bank, fell -29.67% in U.S. dollar terms in the quarter, in part due to a surprise resignation letter from the company’s chairman that made vague references to practices within the bank inconsistent with his personal values and ethics. The Reserve Bank of India subsequently stated that its supervisory inspections of the bank revealed no governance or conduct issues.4
Further removed from the Middle East conflict, several of the quarter’s most meaningful contributors rose on more idiosyncratic developments. Two clusters of stocks stand out in this respect: 1) companies actively engaging in capital recycling (the selling of non-productive assets to fund more productive investments, improve balance sheet efficiency, or shareholder returns) and 2) Latin American financial institutions.
The first group was led by Samsung SDI (Breakup Value and Structural Shift), a South Korean battery manufacturer. It was the Fund’s single largest contributor for the quarter having returned 43.33% in U.S. dollar terms. In February, the company announced plans to sell its 15.22% stake in Samsung Display, a dormant non-core asset on its balance sheet. While the terms and timing are unknown, the potential size of the divestment looks meaningful based on a carrying book value of 11.2 trillion South Korean won (or about $8 billion) as of December 31, 2025. The company plans to use the proceeds to fund investments in its Energy Storage Systems (ESS) business and strengthen its balance sheet following a slowdown in demand for its EV batteries. The company’s ESS batteries segment has received significant orders in recent months and is positioned to benefit from growing demand from the build-out of artificial intelligence (AI) data centers.
Also in the first group, Hongkong Land (Breakup Value and Management Change), an owner and operator of commercial real estate in Hong Kong, mainland China, and Singapore, and Georgia Capital (Breakup Value and Segregated Market), a conglomerate in the Republic of Georgia, appreciated 14.36% and 15.04%, respectively, in U.S. dollar terms in the quarter. Both made progress in capital recycling. Hongkong Land reached over 80% of its $4 billion capital recycling target (announced in 2024, for completion by 2027) through another transaction. In February, the company launched its inaugural private real estate fund with third party capital. Hongkong Land received net proceeds of approximately $600 million for the prime Singapore commercial properties it seeded into the fund. Coinciding with the announcement, it increased its ongoing share buyback by $300 million. In doing so, the company monetized an asset at a market value and allocated the proceeds to buying back its own shares that trade well below their book value. While Georgia Capital had no new divestments in the quarter, it did launch a new share buyback program in February. It continues to execute its strategy of buying back its own shares when the discount to its net asset value presents a higher return than any alternative investment opportunity.
The second group, Latin American financial institutions, also contributed strongly to the Fund’s quarterly performance. These included universal banks in Peru, Brazil, and Mexico as well as a Brazilian dental benefits company and a Brazilian investment platform company. The commonality of these holdings was their fundamental profile: continued high returns on equity, meaningful capital returns to shareholders, and valuations that still implied skepticism about the durability of both. Credicorp (Asset Productivity), Peru’s largest bank, and Itaú Unibanco (Asset Productivity), Brazil’s largest private bank, were the largest two positive contributors to performance of this group. The former’s annual results for 2025, released in February, showed an increase in return on equity to 19% – its highest since 2017. The latter too showed an increasing return on equity, which was over 20% in 2025. Odontoprev (Structural Shift), Brazil’s leading dental benefits provider, also appreciated strongly in the quarter. Its performance was tied to an announced corporate restructuring whereby its parent company, Banco Bradesco, will inject its healthcare and health insurance assets into Odontoprev. The reorganization will transform Odontoprev (to be renamed Bradsaúde S.A) into the holding company for one of Brazil’s largest healthcare platforms. These Brazilian holdings also benefited from the appreciation of the Brazilian real, which gained 5.7% against the U.S. dollar in the quarter.
Allocation
During the first quarter of 2026, the Fund established one new position and exited one existing position.
The Fund added HD Hyundai Marine Solution (Asset Productivity), a South Korea-based provider of aftermarket maintenance, repair, and retrofit services for commercial vessels. The company is part of the HD Hyundai Group and occupies a distinctive position within the conglomerate’s family of businesses: it captures the recurring service demand generated by the large installed base of vessels and engines built by other parts of the group over decades of shipbuilding. Every ship HD Hyundai builds creates a stream of maintenance and overhaul needs over each vessel’s operational lifetime that drives demand for HD Hyundai Marine Solution’s services.
While the shipbuilding industry is capital-intensive and highly cyclical, HD Hyundai Marine Solution’s niche within it is much less so. Maintenance schedules are governed by ongoing engine wear rather than by the order cycle, which provides a degree of earnings visibility unusual for a company whose fortunes are nominally tied to shipping. The installed base that generates this demand is also expanding thanks to HD Hyundai’s ongoing engine and ship-building activity, which gives the company a durable source of organic revenue growth requiring little incremental capital to capture. As a result, the company looks to offer a steady, growing dividend backed by strong free cash flow generation and an unlevered balance sheet.
To help fund the position in HD Hyundai Marine Solution, the Fund exited its position in China Yangtze Power (Structural Shift), the world’s largest hydroelectric power operator, which manages six mega-dams along the Yangtze River, including the Three Gorges Dam. The Fund held this position for approximately nine years over which period the company commissioned two additional mega-dams that expanded total generating capacity by close to 60%. Despite this asset expansion, the company was able to pay a steady and growing dividend, which accounted for a significant part of the Fund’s total return in the position over its holding period.
The decision to exit the stock was driven by valuation more than any change in the underlying business quality. Strong stock performance over the holding period had compressed China Yangtze Power’s dividend yield while its growth outlook became murkier: the Yangtze River is now effectively saturated with economically viable hydropower sites. HD Hyundai Marine Solution offered a superior risk and reward profile and so the replacement was made.
Outlook
We are all investing through the fog of war. As of this time of writing, the Strait of Hormuz remains effectively closed. While there is no shortage of opinions on how the conflict will end and social media-based assurances that the Strait will open in due course, no one really knows.
Financial markets have thus far taken a broadly sanguine interpretation of the conflict’s likely economic consequences. As of April 24, 2026, the S&P 500 Index was back to an all-time high. The Bloomberg EM benchmark was close to flat with its February pre-war peak. Oil futures, the most liquid and continuously updated assessment of the conflict’s energy supply implications, seem to be pricing in some form of return to normalcy by year-end. Brent Crude December 2026 futures peaked at nearly $86 per barrel in March but remain well below the front-month futures, which peaked at $118 per barrel and stood at $105 per barrel at the time of writing.
One should take these pricing signals from markets with deep liquidity and a broad range of informed participants seriously. Yet, at the same time, the conflict remains unresolved, and the Strait is still closed. The risk that the crisis extends for a prolonged period cannot be ignored, given the stakes. With approximately one-fifth of global oil consumption and global LNG production typically passing through the Strait, the economic consequences of a prolonged closure will extend around the world. Some impacts have already been seen: higher gasoline prices at the pump, airlines canceling flights due to jet fuel costs, shortages of cooking gas in India, and Brazilian truck drivers threatening to strike.5 The impacts of shortages in other commodities – such as urea-based fertilizers affecting food prices and helium constraining semiconductor production – may yet be coming down the pike if the closure drags on. The potential inflationary impacts could have knock-on effects on interest rates, foreign exchange rates, and economic growth around the world. Or not…if the Strait re-opens. At the very least, the conflict has shined a light on the economic fragilities linked to a 21-mile-wide stretch of water at the mouth of the Persian Gulf.
The past five years have proven to be rife with unsettling macro uncertainties: a pandemic, a land war in Europe, the announcement of the Liberation Day tariffs a year ago, and now the current conflict in the Middle East. These should cause investors to treat any macro prognostication with a healthy dose of skepticism. Looking ahead over the next five to ten years, further surprises seem inevitable. The fog is always there, even if more readily observable at the present juncture.
This uncertainty has a direct bearing on how one approaches value investing in the emerging markets. Traditional notions of value investing often equate it with buying stocks that screen cheap on a ratio of price-to-earnings, price-to-book, or dividend yield. In practice, such “cheap” valuation multiples are often found in cyclical industries and in lower quality businesses such as those with mediocre competitiveness, state-ownership, and excessive financial leverage. Such companies, while optically cheap, may be more vulnerable to the type of macro shocks listed above. Businesses with weak competitive positioning may struggle to defend margins when input costs rise. Certain state-owned enterprises may face political pressure to subsidize energy costs for domestic consumers or other forms of so-called national service. Overly indebted companies dependent on an uninterrupted stream of cash flows may struggle to weather an unexpected macro surprise. In benign environments, such companies may appear to offer value, only to reveal hidden fundamental risks during a macro storm.
The Fund’s approach has always sought to distinguish between price and value. Low valuation is a necessary condition, but insufficient on its own. We’ve also sought businesses with sustainable competitive advantages that can generate economic value over the long term and with resiliency to withstand the inevitable ups and downs of their respective macro environments. Such companies often have been stress-tested over the years and are managed with a healthy humility of the unknown. An example of this is the aforementioned Credicorp. It has avoided dilutive equity raising over the years as evidenced by its number of shares outstanding remaining at close to 80 million shares since the late 1990s – despite the highs and lows of the Peruvian economy, the 2008-09 Global Financial Crisis, the pandemic, and a chaotic political backdrop. Jardine Matheson (Breakup Value and Management Change), a fifth generation family-owned enterprise, is another example. It has survived since the 1800s through wars, financial crises, and geopolitical upheaval. Its resiliency as a conglomerate in Asia has come partly from its conservatism in its use of leverage and diversification across industries, but also from its ability to adapt and reinvent itself over the decades (see How the Value Team Finds “Gems” in Emerging Markets for more on this topic).
A second distinction worth noting is that of time horizon. To us, the intrinsic value of a business is not determined by the next four quarters of earnings, but rather the discounted sum of its cash flows over the entirety of its operating life – the overwhelming majority of which typically lies beyond the next year or two. Amid the current conflict, we are evaluating the Fund’s holdings through the lens of their lifetime cash flows and how the market is pricing said cash flows – even if the near-term outlook for some remains murky. Given the long duration of these cash flows, a long-term investing approach is requisite to look beyond short-term challenges and uncertainty. The nine-year holding period of China Yangtze Power speaks to the Fund’s practical application of such a long-term approach. Likewise, owning a resilient business with a sufficient margin of safety embedded in its price affords patience to invest through the short-term twists and turns. We are likewise on the lookout for new opportunities where near-term operational stress is overly-penalized relative to long-term intrinsic value – alas, the somewhat tepid market response to the conflict has not yielded much proverbial bathwater being thrown out by investors, let alone babies.
The thick fog ahead has not stopped us from keeping a close eye on what is visible and known. With the facts seeming to change by the day, we are not sitting idly by. For the Fund’s holdings based in the Middle East, in particular, we continue to monitor and assess risks that are both physical and financial in nature and will adjust course as needed. While sentiment may be unpredictable in the months to come, we’ll continue to let fundamentals and valuation be our navigational beacons.
Thank you for entrusting us with your capital. We are honored to serve as your investment adviser in the emerging markets.
Brent Clayton,- The performance data quoted represents past performance and does not guarantee future results. Future returns may be lower or higher. The investment return and principal value will fluctuate so that an investor’s shares, when redeemed, may be worth more or less than the original cost. View the Fund’s most recent month-end performance.
- The views and information discussed in this commentary are as of the date of publication, are subject to change, and may not reflect Seafarer’s current views. The views expressed represent an assessment of market conditions at a specific point in time, are opinions only and should not be relied upon as investment advice regarding a particular investment or markets in general. Such information does not constitute a recommendation to buy or sell specific securities or investment vehicles. It should not be assumed that any investment will be profitable or will equal the performance of the portfolios or any securities or any sectors mentioned herein. The subject matter contained herein has been derived from several sources believed to be reliable and accurate at the time of compilation. Seafarer does not accept any liability for losses either direct or consequential caused by the use of this information.
- As of March 31, 2026, securities mentioned in the portfolio review comprised the following weights in the Seafarer Overseas Value Fund: Fertiglobe PLC (2.0%), Petronet LNG, Ltd. (1.7%), PetroVietnam Technical Services Corp. (2.9%), UPL, Ltd. (1.7%), HDFC Bank, Ltd. (1.6%), Samsung SDI Co., Ltd. (3.6%), Hongkong Land Holdings, Ltd. (4.1%), Georgia Capital PLC (3.8%), Credicorp, Ltd. (2.9%), Itaú Unibanco Holding SA (2.9%), Odontoprev SA (2.1%), HD Hyundai Marine Solution Co., Ltd. (1.2%), and Jardine Matheson Holdings, Ltd. (3.5%). The Fund did not own shares in Qatar Energy, Samsung Display, Banco Bradesco, HD Hyundai Group, or China Yangtze Power. View the Fund’s Top 10 Holdings. Holdings are subject to change.
- Sources: ALPS Fund Services, Inc. and Bloomberg.
- Source: Bloomberg Index Services Limited. BLOOMBERG® is a trademark and service mark of Bloomberg Finance L.P. and its affiliates (collectively “Bloomberg”). Bloomberg or Bloomberg’s licensors own all proprietary rights in the Bloomberg Indices. Neither Bloomberg nor Bloomberg’s licensors approves or endorses this material, or guarantees the accuracy or completeness of any information herein, or makes any warranty, express or implied, as to the results to be obtained therefrom and, to the maximum extent allowed by law, neither shall have any liability or responsibility for injury or damages arising in connection therewith.
- The Seafarer Funds are not sponsored, endorsed, sold, or promoted by Morningstar, Inc. Morningstar, Inc. makes no representation or warranty, express or implied, to the shareholders of the Funds or any member of the public regarding the advisability of investing in the Funds or the ability of the Morningstar Emerging Markets Net Return U.S. Dollar Index to track general equity market performance of emerging markets.
- References to the “Fund” pertain to the Fund’s Institutional share class (ticker: SIVLX). The Investor share class (ticker: SFVLX) returned 3.02% during the quarter. The Retail share class (ticker: SFVRX) returned 3.02% during the quarter. All returns are measured inclusive of Fund distributions paid (in relation to Fund performance) or dividends paid (in relation to index performance), reinvested in full (exclusive of any U.S. taxation) on the pertinent ex-date.
- The performance data quoted represents past performance and does not guarantee future results. Future returns may be lower or higher. The investment return and principal value will fluctuate so that an investor’s shares, when redeemed, may be worth more or less than the original cost. View the Fund’s most recent month-end performance.
- The Fund’s Investor share class began the quarter with a net asset value of $16.90 per share; and it finished the quarter with a value of $17.41 per share. The Fund’s Retail share class began the quarter with a net asset value of $16.88 per share; and it finished the quarter with a value of $17.39 per share.
- “No Governance or Conduct-related Issues Found, RBI Governor Reiterates Stance on HDFC Bank.” The Economic Times, April 8, 2026.
- A threat that, as of the time of writing, has been averted thanks to new measures announced by the Brazilian government to enforce minimum freight rates for truck drivers. For more please see: Milanese, Daniela, Beatriz Reis. “Brazil Acts to Avert Truckers Strike as Oil Surge Fuels Tensions.” Bloomberg, March 18, 2026.
![[Chrome]](/_layout/images/ua/chrome.png)
![[Firefox]](/_layout/images/ua/firefox.png)
![[Opera]](/_layout/images/ua/opera.png)
![[Microsoft Edge]](/_layout/images/ua/edge.png)