
Prevailing Winds is a China-focused blog written by Nicholas Borst, Director of China Research at Seafarer. The blog tracks the economic and financial developments shaping the world’s largest emerging market.
China’s fixed asset investment numbers generate a plethora of headlines every time they are released. Published around two weeks after the end of each month, fixed asset investment is one of the highest frequency indicators showing investment flows in the economy. The statistic is seen as a leading indicator of gross domestic product (GDP) growth and the performance of various sectors.
The shortcomings of the statistic are known, but often ignored. Fixed asset investment is a measure of investment in long-term assets such as plants, buildings, equipment, machinery and land. Analysts often use the statistic as a substitute for capital formation, although fixed asset investment also includes items that should be excluded from strict capital formation measures, such as land and previously owned assets.
Starting last year, several observers noticed something unusual with China’s fixed asset investment numbers. The aggregate amount of fixed asset investment and the growth rates released by the National Bureau of Statistics (NBS) no longer tracked each other. The blue line in Figure 1 is the year-over-year growth rates reported by the NBS and the orange line is the growth rate calculated from the aggregate amounts of fixed asset investment reported for each period.
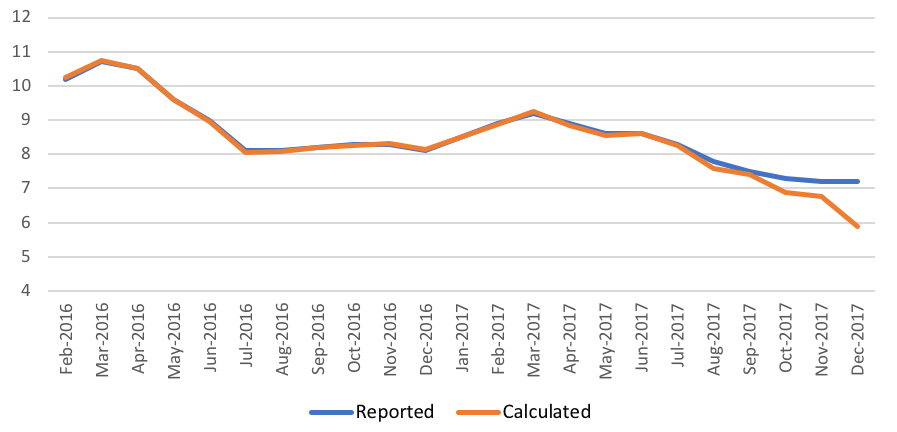
- Sources: WIND, Seafarer.
The extent of this divergence is even more pronounced when looking at China’s various regions as shown in Figure 2. Three regions – Central, Eastern, and Northeast – show enormous gaps between the reported and calculated fixed asset growth numbers. Only in the Western Region do the two series appear to track each other closely.
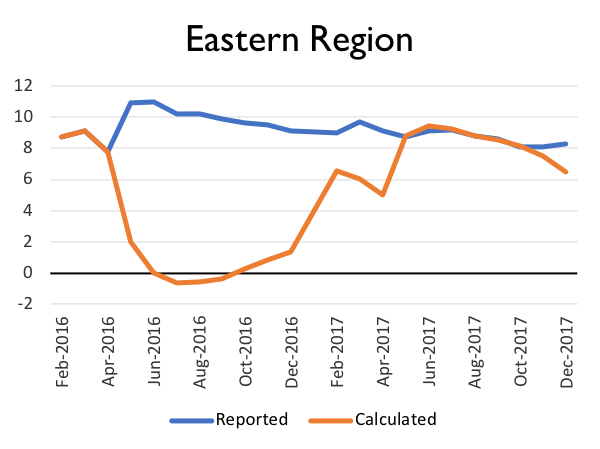
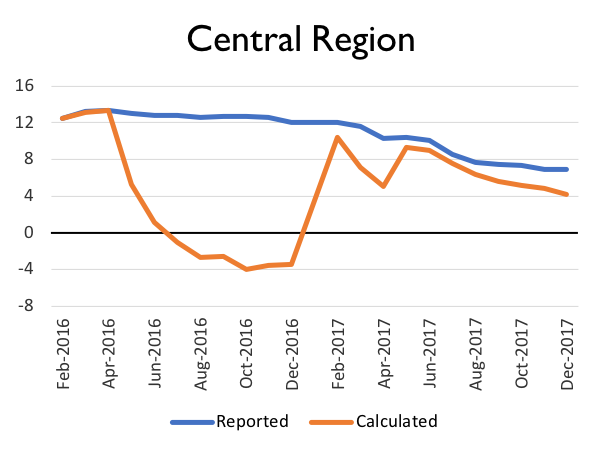
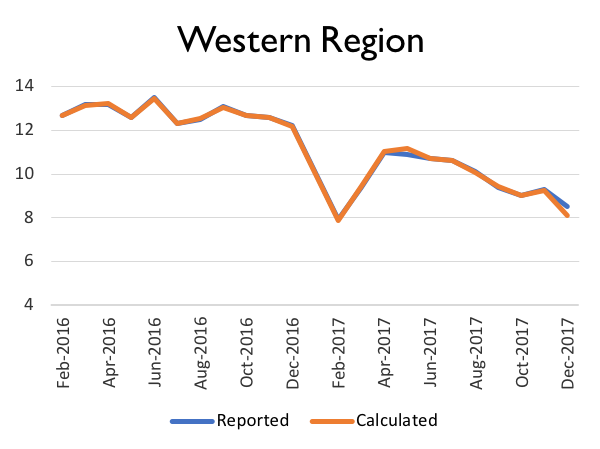
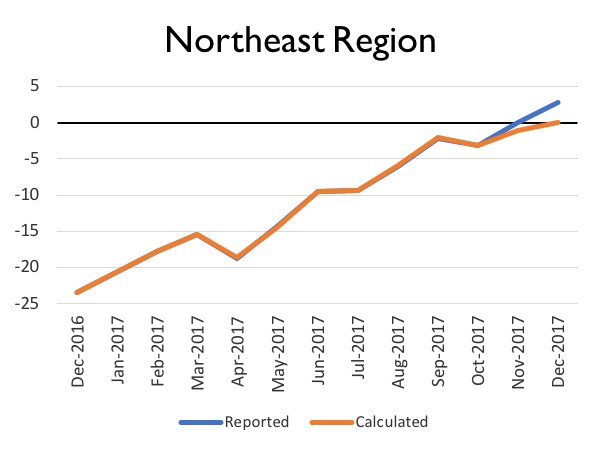
- Sources: WIND, Seafarer.
It’s clear that the growth rates reported by the NBS are now measuring something different than the aggregate amounts of fixed asset investment reported each month. As a result, using these numbers as a basis for economic analysis is now deeply problematic. These numbers have become so unreliable that the head of the Statistics and Analysis Department at the People’s Bank of China wrote last year that fixed asset investment was no longer a good indicator for judging China’s economic condition.
The root cause of the divergence is an overhaul in the statistical collection method. Chinese authorities have historically calculated fixed asset investment via a system that asked project managers for an assessment of the progress of a project and the amount budgeted for investment. Using these two numbers, an estimate of the amount that had been invested was generated. This system was riddled with errors and opportunities for distortion.
In 2013, the NBS began piloting a new collection method that looked at the accumulation of investment assets on corporate and government balance sheets, which are less prone (though not immune) to tampering. The expansion of this new collection method to several provinces has led to the sharp revisions now seen in the official data. Concurrently, the NBS has become much stricter regarding economic data collected from local governments, forcing revisions in statistics that it believes are inflated.
In the long run, these changes should lead to better statistics and a clearer understanding about China’s economy. In the meantime, it can lead to sharp breaks in the data series that confound analysis. For example, based on the aggregate numbers, Shanxi, a province in Northern China, has seen a more than 50% drop in investment levels, yet economic growth hummed along in the province at 7% last year.1 As the new data collection method is rolled out to all of China’s provinces, these types of statistical discontinuities will continue to appear.
All of this is a reminder that Chinese statistics are a work in progress. A large and fast evolving developing economy is extremely difficult to measure, especially when weighted down with outdated statistical methods, such as the old fixed asset investment collection method. China’s statistical authorities are moving in the right direction, but there will always be a gap between official statistics and actual conditions. In the case of fixed asset investment, any news stories written using these numbers should be treated with a healthy dose of skepticism until these reforms in data collection methods are complete.
Nicholas Borst,- The views and information discussed in this commentary are as of the date of publication, are subject to change, and may not reflect Seafarer’s current views. The views expressed represent an assessment of market conditions at a specific point in time, are opinions only and should not be relied upon as investment advice regarding a particular investment or markets in general. Such information does not constitute a recommendation to buy or sell specific securities or investment vehicles. It should not be assumed that any investment will be profitable or will equal the performance of the portfolios or any securities or any sectors mentioned herein. The subject matter contained herein has been derived from several sources believed to be reliable and accurate at the time of compilation. Seafarer does not accept any liability for losses either direct or consequential caused by the use of this information.
- As of March 31, 2018 the Seafarer Funds had no economic interest in the entities referenced in this commentary.
- Sources: WIND, National Bureau of Statistics. Data as of January 2018.
![[Chrome]](/_layout/images/ua/chrome.png)
![[Firefox]](/_layout/images/ua/firefox.png)
![[Opera]](/_layout/images/ua/opera.png)
![[Microsoft Edge]](/_layout/images/ua/edge.png)