
- A comparison of the 2015 and 2018 corrections in the Chinese stock market suggests that the 2015 correction was more severe in terms of market impact, but was not tightly linked to a deterioration in corporate fundamentals.
- In contrast, the 2018 selloff corresponded more directly with a sharp and widespread contraction in corporate profits.
- The A-share market is highly influenced by the speculation of mass market retail investors, which can lead to stock price booms and busts that are detached from the actual performance of the underlying companies.
Prevailing Winds is a China-focused blog written by Nicholas Borst, Director of China Research at Seafarer. The blog tracks the economic and financial developments shaping the world’s largest emerging market.
During the past four years, the Chinese stock market has experienced two major corrections. While both market selloffs were significant, they differed dramatically with respect to magnitude, duration, and correlation to changes in underlying corporate fundamentals. A closer examination of these two events helps illuminate some of the peculiar tendencies of the A-share market.1
The 2015 and 2018 Corrections
As shown in Figure 1, the A-share market fell sharply in both 2015 and 2018. The 2015 market correction was preceded by a rapid (and unsustainable) increase in share prices in the first half of the year. This ended abruptly in the third quarter (Q3) with share prices across all business sectors falling between 25-30%.
The correction was halted somewhat in the fourth quarter as state-backed funds purchased shares to support the market. Once again, the market dipped in Q1 2016 as many state funds sold off these shares. The total market capitalization of China’s domestically listed companies has yet to return to its Q2 2015 high-watermark.
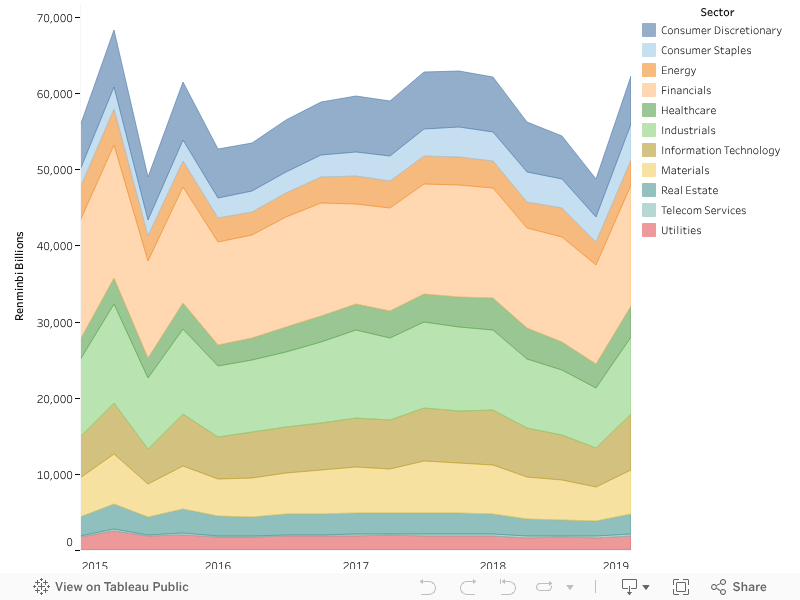
- Source: Wind Information.
The duration of the stock market correction in 2018 was longer but the aggregate decrease in market value was less severe. Whereas the 2015 correction eliminated over 19 trillion renminbi (RMB) in market cap during a single quarter, the decline in 2018 occurred over three quarters and totaled around RMB 13 trillion. Following a high point in January of 2018, A-shares tumbled throughout the rest of the year, with an especially sharp drawdown in Q4 2018. In contrast to 2015, the 2018 contraction was more concentrated in a few sectors, noticeably Consumer Discretionary, Materials, and Information Technology. Other sectors, such as Financials, Energy, Telecom, and Utilities, experienced more moderate declines.
Steadily Growing Corporate Revenues
Figure 2 shows the composition of revenues by sector between Q1 2015 and Q1 2019 on a quarterly basis. The stock market corrections in 2015 and 2018 did not correspond with proportionally large declines in corporate revenues. Additionally, the distribution of revenues between sectors did not change significantly during this period.
It is remarkable how quickly the revenues of A-share companies grew during this period, from about RMB 6.7 trillion in Q1 2015 to RMB 11.4 trillion by Q1 2019 (with a peak of RMB 13.2 trillion in Q4 2018). While 2018 was full of economic turmoil, China’s domestically listed companies managed to report revenues that were more than 15% higher than the previous year.
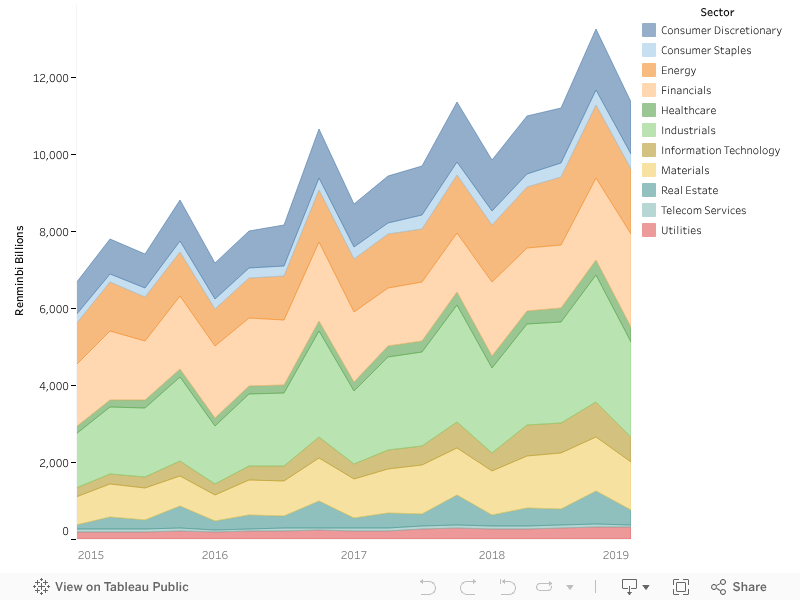
- Source: Wind Information.
Volatile Corporate Profits
Compared with revenues, corporate profits have been more volatile and clearly mirrored the stock market dips. Figure 3 shows the composition of profits during this period by sector on a quarterly basis. The outsized role played by Financials is immediately apparent: while the financial sector only accounted for around 16% of total revenues in 2018, it captured over 50% of total profits.
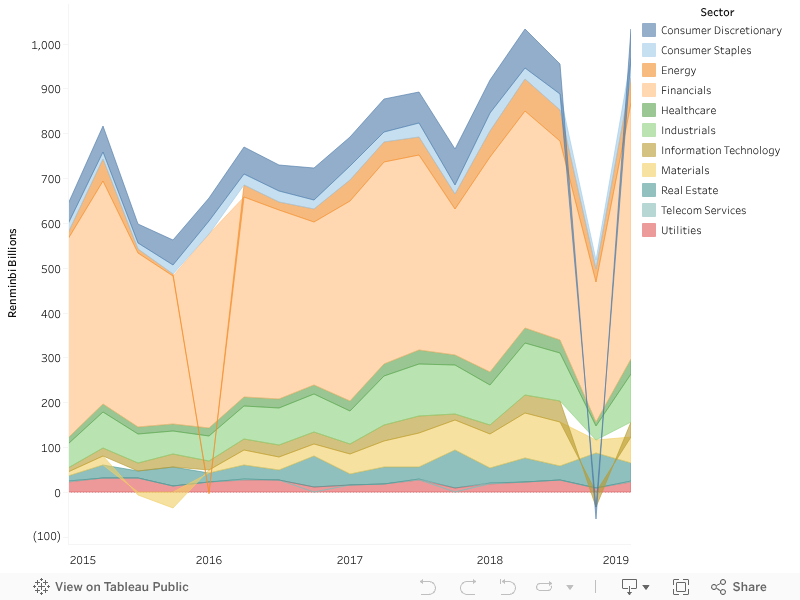
- Source: Wind Information.
Removing Financials from the chart makes the impact of the two stock market corrections even more apparent. As shown in Figure 4, the 2015 stock market crash coincided with an abrupt decline in profits in the Energy and Materials sectors. These two sectors dipped into negative territory before recovering by Q2 2016. Much of the recovery in the Materials sector can be attributed to the steel industry, which swung from huge losses in the latter part of 2015 to profits in the second half of 2016.
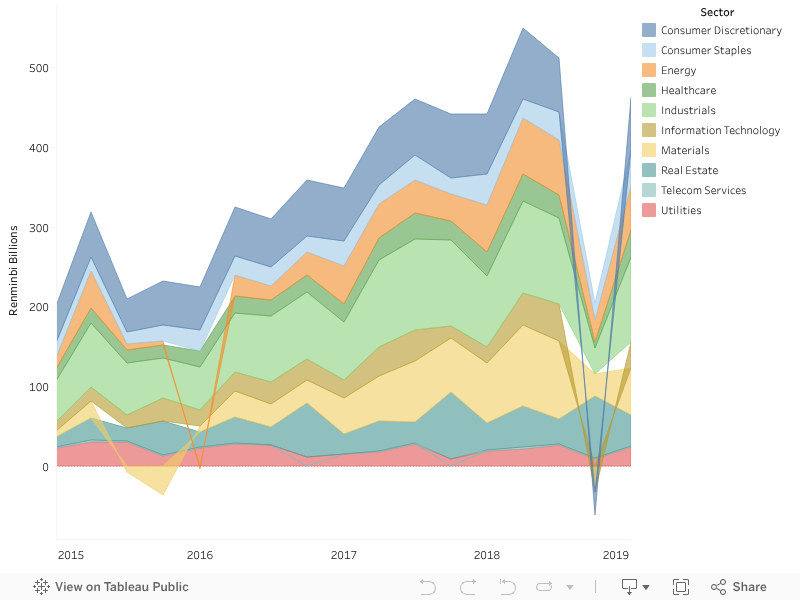
- Source: Wind Information.
The stock market correction in 2018 was matched by an even more dramatic contraction in profits that was spread across multiple industries. The Industrials, Energy, and Materials sectors all displayed sharp declines in profits during Q4. The Consumer Discretionary and Information Technology sectors fell into loss-making territory during that period. Only the Real Estate sector appears to have escaped a large retrenchment in profits. In Q1 2019, profits rebounded impressively but remained below the highs of the previous year.
A Tale of Two Corrections
Due to its growing weight in emerging market indices, China’s A-share market is becoming increasingly important for global investors. As this analysis reveals, the market is still extremely volatile, having experienced two significant market corrections within a relatively short period of time.
The difference in the two corrections is a perfect example of what can make this market so perplexing. The 2015 selloff was concentrated during a single quarter and affected industries almost indiscriminately. Despite the turbulence in the stock market, most sectors did not experience a dramatic reduction in profits (with Energy and Materials being notable exceptions). In contrast, the 2018 selloff corresponded more directly with a sharp contraction in profits. Yet despite the clearer deterioration in business conditions, the underlying market movements were more gradual and smaller in aggregate terms.
China’s A-share market is highly influenced by mass market retail investors and has a lower proportion of institutional investors compared to developed markets like the United States. Retail speculation is rampant and can lead to stock price booms and busts that are detached from the actual performance of the underlying companies. This may help explain some of the wild and seemingly unpredictable swings that continue to drive this market.
These issues will continue to be explored in more detail through a series of future Prevailing Winds posts on China’s A-Share market.
Nicholas Borst,- The views and information discussed in this commentary are as of the date of publication, are subject to change, and may not reflect Seafarer’s current views. The views expressed represent an assessment of market conditions at a specific point in time, are opinions only and should not be relied upon as investment advice regarding a particular investment or markets in general. Such information does not constitute a recommendation to buy or sell specific securities or investment vehicles. It should not be assumed that any investment will be profitable or will equal the performance of the portfolios or any securities or any sectors mentioned herein. The subject matter contained herein has been derived from several sources believed to be reliable and accurate at the time of compilation. Seafarer does not accept any liability for losses either direct or consequential caused by the use of this information.
- The dataset used in this post includes a small number of B-shares, which are domestically-listed stocks in China that trade in a currency other than the renminbi. For simplicity, the dataset is referred to as the A-share market throughout the post.
![[Chrome]](/_layout/images/ua/chrome.png)
![[Firefox]](/_layout/images/ua/firefox.png)
![[Opera]](/_layout/images/ua/opera.png)
![[Microsoft Edge]](/_layout/images/ua/edge.png)