Overview
Investment Objective
The Fund seeks to provide long-term capital appreciation along with some current income; it also seeks to mitigate adverse volatility in returns.
Strategy
The Fund invests primarily in the securities of companies located in developing countries. The Fund invests in several asset classes including dividend-paying common stocks, preferred stocks, and fixed-income securities.
Investment Approach
The Fund seeks to offer investors a relatively stable means of participating in the growth of the developing world. It does so by investing in individual companies that the Adviser believes can generate sustained financial performance, typically manifest in the payment of steady (and sometimes growing) dividends over time.
The Adviser believes that selecting companies capable of paying steady (and sometimes growing) dividends can mitigate a portion of the risk associated with investing in the emerging markets, as dividends can act as an underappreciated signal for the quality of long-term corporate performance.
The Fund’s holdings are selected through bottom-up, fundamental research on individual companies. The research process focuses on cash flow, capital structure and control parties.
Fund Characteristics
| Net Assets | |||||
| Active Share6 | |||||
Portfolio Turnover
|
|||||
| Distribution Frequency | |||||
| Status | SIGIX and SFGRX are open; SFGIX is closed to most new investors | ||||
| Benchmarks |
Bloomberg Emerging Markets Large, Mid, and Small Cap Net Return USD Index
Morningstar Emerging Markets Net Return USD Index
|
||||
Portfolio Management
| Andrew Foster | Lead Manager |
| Paul Espinosa | Lead Manager |
| Lydia So | Lead Manager |
| Kate Jaquet | Co-Manager |
Underlying Portfolio Holdings
| Holdings | |
| % of Net Assets in Top 10 Holdings | |
| Weighted Average Market Cap | |
| Market Cap of Portfolio Median Dollar | |
| Gross Investment Portfolio Yield4 | |
| Price / Book Value4 | |
| Price / Earnings45 | |
| Earnings Per Share Growth45 |
- The performance data quoted represents past performance and does not guarantee future results. Future returns may be lower or higher. The investment return and principal value will fluctuate so that an investor’s shares, when redeemed, may be worth more or less than the original cost. View the Fund’s most recent month-end performance.
Geographic Focus
Developing countries and territories including, but not limited to:
| Africa | Botswana, Ghana, Kenya, Mauritius, Morocco, Nigeria, Tunisia, South Africa, Zimbabwe |
| East and South Asia | Bangladesh, China, India, Indonesia, Malaysia, Pakistan, Philippines, South Korea, Sri Lanka, Taiwan, Thailand, Vietnam |
| Emerging Europe | Bosnia and Herzegovina, Bulgaria, Croatia, Czech Republic, Estonia, Georgia, Greece, Hungary, Lithuania, Kazakhstan, Poland, Romania, Russia, Serbia, Slovenia, Turkey, Ukraine |
| Latin America | Argentina, Brazil, Chile, Colombia, Jamaica, Mexico, Peru, Trinidad and Tobago |
| Middle East | Bahrain, Egypt, Jordan, Kuwait, Lebanon, Oman, Qatar, Saudi Arabia, United Arab Emirates |
Select developed countries and territories with significant economic and financial linkages to developing countries, including, but not limited to, Australia, Hong Kong, Ireland, Israel, Japan, New Zealand, Singapore, and the United Kingdom.
- Sources: ALPS Fund Services, Inc., Bloomberg, Morningstar, Seafarer.
- Portfolio holdings are subject to change.
- Seafarer Capital Partners, LLC has agreed contractually to waive and/or reimburse fees or expenses in order to limit Total Annual Fund Operating Expenses After Fee Waiver / Expense Reimbursements (inclusive of acquired fund fees and expenses other than acquired fund fees and expenses incurred in connection with investments in money market funds and other cash management vehicles, and exclusive of brokerage expenses, interest expenses, taxes and extraordinary expenses) to 1.05%, 1.15%, and 1.35% of the Fund’s average daily net assets for the Institutional, Investor, and Retail share classes, respectively. This agreement shall continue at least through August 31, 2027.
- The 12b-1 Fee is included in the Gross Expense Ratio for SFGRX.
- Shareholders who sign up for an Automatic Investment Plan can request a waiver of the Institutional Class investment minimum. View the waiver program criteria.
- Calculated as a harmonic average of the underlying portfolio holdings.
- Based on consensus earnings estimates for next year. Excludes securities for which consensus earnings estimates are not available.
- © Morningstar, Inc. All rights reserved. The Active Share data is proprietary to Morningstar and/or its content providers; may not be copied or distributed; and is not warranted to be accurate, complete, or timely. Neither Morningstar nor its content providers are responsible for any damages or losses arising from any use of this information. Past performance is no guarantee of future results.
Performance
Total Returns
As of (Prior Month)
| 43 | NAV / Index Level () | Annualized | Cumulative | Inception Date | Net Expense Ratio2 | Gross Expense Ratio2 | ||||||||
|---|---|---|---|---|---|---|---|---|---|---|---|---|---|---|
| YTD | 1 Mo | 3 Mo | 1 Yr | 3 Yr | 5 Yr | 7 Yr | 10 Yr | Since Inception1 | Since Inception1 | |||||
As of (Prior Quarter)
| 43 | NAV / Index Level () | Annualized | Cumulative | Inception Date | Net Expense Ratio2 | Gross Expense Ratio2 | ||||||||
|---|---|---|---|---|---|---|---|---|---|---|---|---|---|---|
| YTD | 1 Mo | 3 Mo | 1 Yr | 3 Yr | 5 Yr | 7 Yr | 10 Yr | Since Inception1 | Since Inception1 | |||||
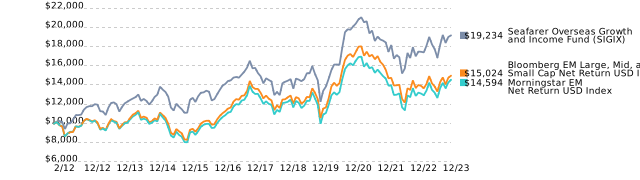
- The rates of return are hypothetical and do not represent the returns of any particular investment.
- Fund performance is presented in U.S. dollar terms, with U.S. jurisdiction distributions reinvested on a gross (pre-tax) basis. For the Bloomberg and Morningstar indices, performance is calculated to reflect the reinvestment of dividends, capital gains, and other corporate actions net of foreign jurisdiction withholding taxes. The performance data quoted represents past performance and does not guarantee future results. Future returns may be lower or higher. The investment return and principal value will fluctuate so that an investor’s shares, when redeemed, may be worth more or less than the original cost.
- Source: ALPS Fund Services, Inc.
Return Characteristics as of
Relative to the Bloomberg Emerging Markets Large, Mid, and Small Cap Net Return USD Index except where noted.
| 3 years | Since Inception5 | |
|---|---|---|
| Alpha | ||
| Beta | ||
| R-squared | ||
| R-squared vs. S&P 500 Index | ||
| Upside Capture Ratio | ||
| Downside Capture Ratio |
- Source: Morningstar.6
- “Since Inception” returns for the Bloomberg and Morningstar indices are as of the inception date of the Fund’s Institutional and Investor share classes.
- Seafarer Capital Partners, LLC has agreed contractually to waive and/or reimburse fees or expenses in order to limit Total Annual Fund Operating Expenses After Fee Waiver / Expense Reimbursements (inclusive of acquired fund fees and expenses other than acquired fund fees and expenses incurred in connection with investments in money market funds and other cash management vehicles, and exclusive of brokerage expenses, interest expenses, taxes and extraordinary expenses) to 1.05%, 1.15%, and 1.35% of the Fund’s average daily net assets for the Institutional, Investor, and Retail share classes, respectively. This agreement shall continue at least through August 31, 2027.
- Source: Bloomberg Index Services Limited. BLOOMBERG® is a trademark and service mark of Bloomberg Finance L.P. and its affiliates (collectively “Bloomberg”). Bloomberg or Bloomberg’s licensors own all proprietary rights in the Bloomberg Indices. Neither Bloomberg nor Bloomberg’s licensors approves or endorses this material, or guarantees the accuracy or completeness of any information herein, or makes any warranty, express or implied, as to the results to be obtained therefrom and, to the maximum extent allowed by law, neither shall have any liability or responsibility for injury or damages arising in connection therewith.
- The Seafarer Funds are not sponsored, endorsed, sold, or promoted by Morningstar, Inc. Morningstar, Inc. makes no representation or warranty, express or implied, to the shareholders of the Funds or any member of the public regarding the advisability of investing in the Funds or the ability of the Morningstar Emerging Markets Net Return U.S. Dollar Index to track general equity market performance of emerging markets.
- As of 3/1/12. The Fund’s inception date is 2/15/12 but Morningstar data is only available as of the beginning of the following month.
- © Morningstar, Inc. All rights reserved. The data in the Return Characteristics table is proprietary to Morningstar and/or its content providers; may not be copied or distributed; and is not warranted to be accurate, complete, or timely. Neither Morningstar nor its content providers are responsible for any damages or losses arising from any use of this information. Past performance is no guarantee of future results.
Composition
Top 10 Holdings as of
| Holding | Sector | Country | Style1 | Issuer Mkt Cap ($B) | Yield2 | Price/ Book | Price/ Earnings3 | EPS Growth34 |
|---|
- Portfolio holdings are subject to change.
- Sources: ALPS Fund Services, Inc., Bloomberg, Seafarer.
Portfolio Composition by Region as of
| All Holdings | ADRs, Common & Preferred Equities Only | ||||||||||
|---|---|---|---|---|---|---|---|---|---|---|---|
| % Net Assets | Price / Earnings56 | EPS Growth56 | |||||||||
| Region | # of Holdings | Fund | +/− vs. Index | Avg Mkt Cap ($B) | Gross Yield5 | Price / Book5 | Prior Year | This Year | Next Year | This Year | Next Year |
- Sources: ALPS Fund Services, Inc., Bloomberg, Seafarer.
Portfolio Composition by Sector as of
| All Holdings | ADRs, Common & Preferred Equities Only | ||||||||||
|---|---|---|---|---|---|---|---|---|---|---|---|
| % Net Assets | Price / Earnings56 | EPS Growth56 | |||||||||
| Sector | # of Holdings | Fund | +/− vs. Index | Avg Mkt Cap ($B) | Gross Yield5 | Price / Book5 | Prior Year | This Year | Next Year | This Year | Next Year |
- Sources: ALPS Fund Services, Inc., Bloomberg, Seafarer.
- 30-Day SEC Yield: ()
- The performance data quoted represents past performance and does not guarantee future results. Future returns may be lower or higher. The investment return and principal value will fluctuate so that an investor’s shares, when redeemed, may be worth more or less than the original cost. View the Fund’s most recent month-end performance.
Portfolio Composition by Style as of
| Investment Style1 | # of Holdings | % Net Assets |
|---|
- Source: Seafarer.
Portfolio Composition by Asset Class as of
| Asset Class | # of Holdings | % Net Assets |
|---|
- Source: ALPS Fund Services, Inc.
Portfolio Composition by Market Capitalization as of
| Market Capitalization | # of Holdings | % Net Assets | +/− vs. Index |
|---|
- Sources: ALPS Fund Services, Inc., Seafarer.
- Due to rounding, percentage values may not sum to 100%. Values less than 0.5% may be rounded to 0%.
-
Investment Styles The Growth and Income Fund selects a range of securities by employing distinct research capabilities across three investment styles.
Style Characteristics of Holdings Balanced Moderately underappreciated growth Typically moderately elevated current yield Growth Higher growth potential Typically lower current yield; sometimes no yield (dividend policy not yet established) Value Lower growth potential Typically higher current yield; sometimes no yield (dividends canceled under financial stress) Please note that the classification of a given security within one of three investment styles (Balanced, Growth, Value) is not driven by observable security characteristics (e.g., price/earnings or price/book ratios, or estimated growth rates) but rather by the specialist Seafarer research team that discovered, researched, and introduced the security to the portfolio. In other words, the provenance of the security's introduction to the portfolio determines its classification rather than any observable characteristics or descriptive statistics. A security's characteristics might change or fluctuate over time, but its “style” will typically remain fixed throughout.
- Yield = dividend yield for common and preferred stocks and yield to maturity for bonds.
- Based on consensus earnings estimates for next year.
- Consensus EPS Growth forecasts (produced by research arms of investment banks) suggest that this company's earnings will improve, leading to substantial percentage growth in profits; however, such consensus forecasts are subject to a very high degree of uncertainty.
- Calculated as a harmonic average of the underlying portfolio holdings.
- Based on consensus earnings estimates. Excludes securities for which consensus earnings estimates are not available.
Distributions
For More Information
Individual Investors
- (855) 732-9220 (Mon–Fri 9am–8pm ET)
- seafarerfunds@alpsinc.com
Investment Professionals
- (415) 578-5809 (Mon–Fri 9am–8pm ET)
- Send a Message
Estimates for the Fund’s year-end distributions will be available on this page the week of . To be notified when the estimates are available, sign up for Seafarer email updates.
2026 Distribution Dates
Distribution frequency: Semi-annual
Please note: future dates are subject to change.
| Ex, Pay and |
||
|---|---|---|
| Mid-year Distribution | ||
| Year-end Distribution |
Historical Distributions
| Ex, Pay and | Reinvest | Ordinary | Short Term | Long Term | Total Distrib. | Cumulative Distrib. |
|---|---|---|---|---|---|---|
| SIGIX (Institutional Class) | ||||||
| SFGIX (Investor Class) | ||||||
| SFGRX (Retail Class) | ||||||
For more information on the Fund’s distribution policies, please see the “Dividends and Distributions” section of the Prospectus.
Foreign Source Income
The Seafarer Overseas Growth and Income Fund has elected to pass through to shareholders the foreign taxes paid on income earned from foreign investments. These foreign taxes are reported in Box 7 of Form 1099-DIV. As a shareholder in the Fund, you may be able to claim a tax credit or an itemized deduction on your federal tax return for the amount of taxes paid to foreign countries. Please consult your tax adviser.
| Year | Foreign Source Income |
|---|---|
- Past performance is no guarantee of future results. There is no guarantee that the Fund will pay or continue to pay distributions.
Portfolio Review
Portfolio Review – Second Quarter 2026
During the second quarter of 2026, the Seafarer Overseas Growth and Income Fund returned 13.47%.12 The Fund’s benchmark indices, the Bloomberg Emerging Markets Large, Mid, and Small Cap Net Return USD Index and the Morningstar Emerging Markets Net Return USD Index, returned 19.86% and 22.41%, respectively. By way of broader comparison, the S&P 500 Index returned 15.20%.
The Fund began the quarter with a net asset value of $15.32 per share. During the quarter the Fund paid a semi-annual distribution of approximately $0.482 per share. This payment brought the cumulative distribution, as measured from the Fund’s inception, to $6.487 per share.3 The Fund finished the quarter with a value of $16.90 per share.4
Performance
In the ninety-one days between the end of March and the end of June, the Fund generated its third best quarterly performance in its fourteen-year history, rising over 13%.5 Yet as the record above makes clear, the Fund nonetheless trailed the performance of the Bloomberg EM benchmark by a substantial margin. The reason for this is both simple and complex at once: I believe that critical portions of the equity market now represent a “bubble.” For the past year, and particularly during the last quarter, Seafarer has sought to steer the Fund away from participation in the speculative excess. Our decision has dampened returns in the short run; we have done so in the hope that it will reduce exposure to the eventual rupture.
I will lay out my case for the existence of a bubble below, in the Outlook section of this review. However, I note that to the extent that a bubble exists, it had an extreme effect on performance (as bubbles are wont to do). While the Bloomberg EM benchmark rose nearly 20% in the quarter, the gain was not the result of a broad-based rally. Rather, the index was propelled almost exclusively by a single sector: technology stocks (principally semiconductor companies). The tech sector alone contributed 18.4% of the index’s gain – or 93% of the upside. Yet even that extreme statistic belies the extent of the benchmark’s lopsided, concentrated nature: only three stocks drove the index 10.7% higher, or 54% of the total upside.
In over a quarter century as a professional investor, I have not witnessed such concentrated performance, or such extreme conditions. U.S. investors may fret over the prominence of the “Magnificent Seven” within the S&P 500. However, by comparison, the “Mag Seven” pale in comparison to the “Mega Three” that now dominate emerging market benchmarks’ performance and construction. Samsung Electronics (the Fund’s largest holding), Taiwan Semiconductor and SK Hynix together now represent 21.3% of the Fund’s benchmark.6 The same securities represent 28.0% of the largest U.S.-listed emerging market exchange-traded fund (ETF).7 Bloomberg reported a concentration of 30.9% in these three securities within one of the most prominent emerging indices.8 While I do not follow U.S. equities closely enough to know the precise weight of the “Magnificent Seven” within the S&P 500, my understanding is that it was about 34% at the end of June. Thus, just three stocks in the emerging markets bore 80% to 90% of the weight that the top seven stocks do in the U.S. – which itself reflects an unprecedented degree of concentration.
In contrast to the highly concentrated performance of the benchmark, the Fund derived performance from a wider variety of sources. While technology stocks made the single largest contribution to the Fund’s performance (led by Samsung Electronics), the Fund saw substantial gains from Consumer Discretionary stocks (a sector for which the benchmark saw negative contribution), Financial Services stocks (both the Fund and the index saw gains), and Energy stocks (here too, the benchmark lost money for the quarter).
At this juncture, we believe the Fund’s diversity among its sources of return is both encouraging and critical: many investment strategies, whether active or passive, have grown exceedingly concentrated in and dependent on a small number of holdings. As noted above, typical emerging market strategies often hold 30% or more in just three semiconductor stocks that are intertwined with the adoption of artificial intelligence (AI). However, beyond that immediate concentration, typical strategies are highly concentrated in roughly three or four countries – Taiwan, South Korea, and to a lesser extent, China and India. By contrast, your Fund is broadly diversified across countries and sectors, which is critical given that a broad-based earnings boom is underway (see the penultimate paragraph in the Outlook section below for details). We are concentrating on deriving performance from a multitude of geographies, industries and companies, rather than concentrating everything on what has worked best recently.
One final comment regarding performance: as noted above, the Fund paid a semi-annual distribution of approximately 48 cents per share. That constitutes the largest single distribution of current income in the fourteen-year history of the Fund by a wide margin. As the Fund’s formal objective includes the pursuit of current income, I am pleased that the underlying portfolio holdings are presently cash-generative enough to fulfill that objective amply. In contrast, I note that many of the companies and stocks that are at the center of the boom of artificial intelligence pay scant or no dividends and are instead raising collectively hundreds of billions of dollars in new debt and equity.
Allocation
The Fund undertook four main changes this quarter: it added two new positions (Swire, a Hong Kong-based conglomerate, and ALS Limited, an Australia-based industrial testing company); it deleted the last vestige of its holding in Alibaba, a China-based e-commerce and AI services company; and it substantially reduced its exposure to South Korea,9 notably by selling the vast majority of gains in Samsung Electronics and Hyundai Mobis, the Fund’s two largest positions for the past five years.
Our Value Team’s work led to the introduction of Swire Pacific to the Fund. Swire is an Asia-focused conglomerate with roots dating back to the 1860s in Hong Kong and China. It is perhaps best known as a luxury property developer and investor, but it has business interests that span airlines (it owns the controlling stake in Cathay Pacific, arguably East Asia’s preeminent carrier) and soft drinks (it owns a key Coca-Cola concession in mainland China). Our team has been impressed by Swire’s management, particularly by its efforts to exit underperforming business, pay special dividends and repurchase shares. The company has two classes of publicly-traded stock, and the Fund has decided to add both, in varying proportions.
Our Growth Team introduced ALS Limited to the Fund. While ALS is based in Australia, it has business interests around the world, the majority of which are found in developing countries. The company has a long history, one that can be traced over 150 years. The company is a global leader in industrial testing services. Historically, the company’s primary emphasis has been on geochemistry in service to the mining industry, helping to test core samples and assays for development purposes. However, over the past few decades, the company has diversified into pharmaceutical testing (for purity, etc.), environmental testing (for compliance and abatement) and food testing (health, safety, purity, etc.). Our team was intrigued by the idea that the market seems to perceive the company as heavily dependent on the cyclical mining industry, when in fact it enjoys less cyclical – and higher quality, in our view – earnings derived from diversified sources.
The Fund exited the Hong Kong-listed common stock of Alibaba, which it has held for the past four years. The Fund experienced substantial gains in the shares, in part due to the company’s booming AI services, data management and data hosting. However, we have also observed the company’s core, historically cash-generative e-commerce business struggle with weak demand and destructive levels of competition. The Fund winnowed the position over the past few quarters in response, exiting the final shares during the quarter.
Lastly, the Fund substantially reduced its exposure to South Korea,9 particularly by selling nearly all of the rapid gains that accrued in Samsung Electronics (a leading chip maker that has experienced booming demand amid global AI expenditures) and Hyundai Mobis (a producer of auto systems and parts which also happens to be perceived as an emerging leader in the nascent robotics industry). Those two positions had been the two largest holdings of the Fund for well over five years, and drove a large “overweighting” in South Korea. Both shares boomed during the quarter, swept up in the global investment frenzy over AI. The Fund sold most of those gains in order to “lean away” from what we believe to be an acute bubble that has formed among AI stocks (see the Outlook section below). The net proceeds were distributed widely across the portfolio.
Outlook
I believe global equity markets have generated yet another bubble. Any use of that ambiguous term inevitably conjures up a disparate set of reactions, so I wish to be precise: the bubble I perceive is centered upon companies associated with the adoption and propagation of artificial intelligence. In practice, and within the developing world, this means semiconductor and technology hardware stocks principally located in Taiwan, South Korea and to a lesser extent, China. In the rest of the world, I suspect stocks broadly related to AI are likewise swept up in the same bubble. However, this AI-driven bubble is acute in comparison to preceding ones. Apart from AI-linked stocks, I do not perceive a broader bubble across the emerging markets, nor can I comment on global equities otherwise.
To clarify further: I am not an “AI-doubter.” I believe the technologies that lie at the center of the bubble have the potential to be highly valuable to society. Many past equity bubbles have been spun around overhyped themes and flimsy businesses. Such concerns do not seem applicable now. AI is not particularly “overhyped,” and at least the major businesses pursuing its advancement are not “flimsy.” Rather, most of the businesses are impressive, and AI technologies have the potential to usher revolutionary social and economic changes – likely in ways that we cannot yet imagine.
Yet this is at least part of the problem: rather than acknowledge the uncertainty and change that are sweeping through the global economy, investors have awarded a select few companies valuations that suggest their future dominance in a radically revised world is all but certain. Those valuations are predicated on financing plans that are unlikely to prove feasible, capital expenditure plans that are not sustainable, and growth trajectories that will likely fall short amid a rapidly changing, deeply uncertain world.
I believe there are five clear signs that a bubble has formed among many (though perhaps not all) AI-linked companies. None of these indications alone are substantial enough to prove that a bubble exists. However, when assessed collectively, I think they constitute definitive evidence of a gross market malfunction:
1. Vast funding needs may place exceptional strain on capital markets, possibly to the point of failure.
Between 2010 and 2022, several companies that produced software-based services and products enjoyed remarkable profitability, characterized by substantial cash generation combined with low capital intensity (i.e., they did not need to make substantial investments to maintain or grow their profits). Oracle, Google, Facebook, Amazon and Microsoft all generally fit this description. However, with the advent of AI, those “low capital intensity” business models have been inverted: companies that wish to stay at the forefront of the new technology have been forced to invest aggressively in semiconductors and the construction of data centers, even as their ordinary expenses have also ballooned (for model training costs, energy and water consumption, and especially personnel costs).
The resulting financial strain has meant that companies that were once incredibly capital generative are now increasingly strapped for cash. Alphabet (the parent company of Google) has raised $90 billion in new equity; Meta (Facebook’s parent company) has raised tens of billions in debt.10 In the past year, Oracle has raised both debt and equity -- $43 billion of the former, $5 billion of the latter, and it has assumed another $72 billion in off-balance sheet liabilities associated with data center tenancy. Microsoft is on the cusp of issuing new debt and is rumored to be contemplating raising equity; Amazon may issue equity as well.11
The rapacious demand for capital from once cash-generative companies has placed a strain on capital markets. Globally, $570 billion in new debt is reported to have been raised in the past year, primarily to fund data centers and their construction.12 Investors are beginning to balk. For instance, a recent $12.5 billion off-balance sheet debt deal launched by Meta met with tepid demand, such that Meta was forced to bear interest rates near what a “junk bond” issuer might ordinarily pay, despite its characterization as a “blue chip” borrower.12 Furthermore, the prices of credit-default swaps (a form of tradable insurance against default on debt) have surged for Meta, Oracle, Alphabet and the newly-listed SpaceX (another big AI-spender).12
Yet the $570 billion is only the proverbial “drop in the bucket.” J.P. Morgan has released a forecast for AI-related capital expenditure of $5.5 trillion over the next 5 years; the forecast assumes that only $1 trillion of that need will be met by organic cash flow (i.e. profits).13 The rest must be raised from capital markets. Further, the same report suggests that most of the larger borrowers will experience substantial cashflow strain when servicing their debts (i.e., paying interest and repaying capital). For this reason, some debt is being structured with flexible repayment schedules in case the underlying assets are distressed. All of this suggests to me that if the $5.5 trillion expenditure forecast is realized, the potential cash flow shortfall among the issuers is larger than $4.5 trillion.
Modern financial markets are incredibly efficient at channeling capital from those who have an excess to those who need it, but they are not magical. So far, debt markets have shown signs of strain but have met funding needs. I wonder how much longer they will do so. The looming $4.5 trillion capital deficit makes the AI spending binge precarious, sensitive to any retreat in investors’ willingness to fund the gap. This sort of mismatch – a yawning deficit dependent on volatile (and often fickle) sentiment – is in my view the definition of an unsustainable condition.
2. Aggressive capital expenditure plans do not account for critical but unresolved constraints.
As much as the future funding needs should give investors pause, the binding constraint on the generative AI industry might be the availability of power on the electrical grid rather than capital expenditure. As I believe most investors are now aware, the generation of large language models and other forms of artificial intelligence requires vast quantities of electricity. Surging demand for electricity has placed a large strain on the antiquated, fragmented electrical grid: for example, the largest regional grid in the country – PJM Interconnection LLC, which serves 13 states and Washington D.C. – stated recently that supply costs have risen 60% in the past year, and that recent auctions to procure future power from generation companies have failed, repeatedly.14
Problematically, most U.S. grids were designed primarily to serve households, with mandates that emphasize reliable power delivered at stable prices. They were not designed, practically or politically, to serve the needs of a rapidly growing, heavily consumptive industry. Spiking prices have squeezed households, and organized political resistance has already begun to crimp the AI industry’s access to existing electrical grids and generation resources. The largest hub of data centers in the world is in Virginia. The local utility has imposed a waiting period ranging from three to five years for large-scale operators to connect to the local grid.15 The mismatch between new demand and existing supply is striking. The new data center customers queuing at the utility will require 40 gigawatts of new capacity. Historically, the utility has generated only 25 gigawatts for all of its existing customers at peak load.16 While the capacity constraints in Virginia may be particularly acute, substantial mismatches between demand and supply are contributing to delays, spiking costs and political tensions around the country.
Yet if the $5.5 trillion in projected capital expenditures for computing capacity comes to pass, electricity shortages and poor grid efficiency have only just begun to impede the AI industry. Time-consuming impediments to new, cheaper power sources exist at every stage in the process: design, review, permitting, and construction. Once a new generation facility is built, it must interconnect with the grid – but as of the end of 2023, a backlog of 2,600 gigawatts (twice U.S. generation capacity) was in limbo, awaiting interconnection.15 Such delays are prompting some data center operators to build their own local, dedicated generation capabilities (e.g., gas turbines). But such plans only reduce electrical efficiency and raise costs (and most projects will still be required to interconnect to the grid, both for regulatory reasons and to ensure a backup source of supply, should the local turbine fail).
The process of bringing new power onto the grid – and ensuring the grid is efficient and safe enough to distribute it – is slow, complicated, costly and highly politicized. The U.S. electrical grid does not appear prepared to handle the requisite loads. Some investors imagine that the shortfall will be rectified via local, captive generation capacities (e.g., dedicated gas turbines, or small-scale nuclear reactors). However, piecemeal solutions of that sort will likely fall short on both regulatory and efficiency grounds. There is no “silver bullet” solution or new technology that will quickly and efficiently resolve the power constraints. Thus, even if all the capacity gets funded and built, it is doubtful whether it can all be switched on in time to become economically productive.
3. The means of “monetization” for AI services is unclear, and while returns from the technology might ultimately justify investment, such returns might not manifest fast enough to service debts as they come due.
How and when such AI investment will become economically productive is another critical argument. While AI’s prospective capability to transform economies is clear, its ability to make returns sufficient to justify the coming scale of investment is not – particularly given the debt servicing costs that will soon come due.
The path to “monetization” of AI services is unclear: AI does not yet have a clear path to generating revenues commensurate with the scale of its initial adoption. Many companies (including Seafarer) are either experimenting with or integrating AI into their workflows, begetting pronounced growth. Yet this growth has been subsidized by generative AI companies and ancillary vendors that have offered AI services at a fraction of the cost (or in some cases, for free). To stem ballooning losses, generative AI companies have slowly begun to introduce revenue models that reduce subsidization and at least partially charge for consumption.
However, initial reports suggest that companies will struggle to achieve efficient cost-benefit tradeoffs as they further integrate AI. Over the past few years, the global consultancy McKinsey has developed an expertise in advising on the effective and efficient implementation of AI. Yet despite this expertise, McKinsey’s Chief Financial Officer (CFO) recently stated the firm’s own AI costs escalated dramatically in 2026, from “being largely invisible … to being somewhere between substantial and scary….”17 The CFO noted that token usage (a means of measuring the resource intensity of AI consumption) had risen dramatically, even as the price per token had not fallen according to the consultancy’s expectations. Some consultants at the firm were now using tokens that are “more expensive than their own salary.”17
Likewise, Meta previously encouraged token consumption throughout its organization to speed AI adoption and diffusion. Yet recently Meta reversed its stance, capping and rationing token consumption.18 While Meta did not disclose its rationale, it is evidently because token production costs rapidly outstripped demonstrable benefits. This is a notable turn of events, as Meta is one of the few “hyperscalers” capable of generating its own AI models – and presumably it can pass tokens on to its employees at the lowest marginal costs.
The Economist has examined the big picture for the economics of the AI industry and found them wanting. In a recent article, The Economist estimated that the generative AI industry would ultimately need to produce $2.5 trillion in annual revenue to afford forecast capital expenditure without recourse to external financing.19 According to the article, that figure is larger than the technology sector’s entire combined revenues today.19 While no one knows precisely the revenues produced by generative AI companies, the same article publishes estimates from different sources that range between $150 billion and $218 billion (The Economist’s own estimate constitutes the low end).19 Such sales will undoubtedly grow quickly, particularly while consumption is partially subsidized. Yet as McKinsey and Meta illustrate, demand for costly token consumption is spiraling faster than companies’ appetites to pay for it – and thus the path to an equilibrium between AI demand and AI supply may be a rough one. It will be even rockier if free or nearly-free open-source AI models become widely adopted.
By no means do I suggest that AI will prove counterproductive, such that costs ultimately outweigh benefits. Indeed, I think efficient, wide-scale adoption will transpire. Yet I also think the industry’s path towards equilibrium – a condition where AI revenues amply cover AI generation costs, including capital expenditure and debt repayment – could be messy, protracted and perhaps not as expansive or lucrative as current valuations imply. If so, the equity and debt markets that are funding with aplomb the projected $5.5 trillion in capital expenditure are on course to be shaken, badly.
4. Some theorists suggest that the current capital expenditure boom will prove duplicative; if so, it will likely result in excess capacity, wasted resources and substantial capital loss.
I am not a technologist, nor a visionary, but I hew to an opinion that seems plausible to some notable figures within the AI community: the world might not need more than a small number of frontier models to generate Artificial General Intelligence (“AGI”).20 At least one visionary goes further, predicting that once a few leading models generate AGI, those models will engage in such staggering and rapid self-development that all other models will become obsolete, quickly.21
Scenarios that involve dramatic model consolidation or rapid model obsolescence are but a few of many possibilities for the future. However, I attach material probability to such scenarios, and I believe they warrant investors’ attention. Many of the global companies now racing to train models and build or buy “compute” might ultimately be redundant. If so, a substantial portion of their forecast expenditures – the $5.5 trillion that is currently supporting semiconductor stock prices – might prove duplicative. Perhaps some of the duplicative investment will not be wasted: data centers could be repurposed for the few companies that survive and those that produce AGI earliest. Yet still, will those repurposed assets earn returns commensurate with current lofty expectations? Will such assets generate returns that can service the debts that will come due? I suspect that most will not.
Worrisomely, there are already indications of redundancy among the spending habits of leading hyperscalers. Meta has announced that its capital expenditure has ballooned to such a size (up to $145 billion in 2026) that the company’s cash flow is under substantial strain.22 Further, this surge in investment is not driven by the need to support Meta’s own generative AI – which generally lags performance benchmarks set by industry leaders – but by Meta’s hope to sell its excess computing resources to other parties.22 In other words, Meta is straining to invest aggressively in capacity that it suspects it will not need. If this is already happening prior to the development of superintelligence, what sort of excess capacity will exist thereafter?
5. Stock markets are exhibiting gross indiscipline regarding price discovery and valuation.
I know well that equity markets are wild and can sometimes make pronounced valuation errors. Indeed, mis-valuation is the basis for my job. Yet even as valuation errors might occasionally occur, I have respect for the market’s general efficiency. My experience is that most of the time, for most public equities, the market is exceptionally capable of efficient price discovery.23 Ironically, that respect is what leads me to think a bubble has formed now: presently, I can point to many instances of gross indiscipline. Indeed, the market has in some cases gone bonkers. I will provide a few notable examples.
I think the most stunning, “big picture” example of mis-valuation is evident in the market’s willingness to price stocks based on an underlying presumption of extreme stability and certainty, even as the present moment is objectively unstable and deeply uncertain. One can observe this misguided “certainty premium” in the valuations placed on companies deemed to be early AI “leaders.” Such valuations imply that such companies will not be seriously tested by competition, such that their dominance will likely grow. Yet already we can observe competition underway, giving rise to shifting leadership among generative AI companies, hyperscalers, application providers, semiconductor companies and companies that provide critical equipment. These shifts belie the lofty valuations and have already wrought pronounced volatility as yesterday’s “leaders” have been eclipsed.
Likewise, we’ve seen the market consign supposedly lagging companies to valuations that imply sustained misfortune, or in some cases, imminent failure. Yet several such companies have performed in a manner that suggested the market’s judgment was rendered exceptionally poorly, or at least way too soon. One example that had a direct impact on your Fund: Samsung Electronics, the Fund’s largest holding in 2024 (and its largest holding now), was deemed to have been eclipsed as a leading semiconductor company. It did not produce the chips that were then most valuable for AI (“graphics processing units,” or “GPUs,” were the only chips deemed particularly essential). Meanwhile, the memory chips it produced were deemed too commodified for use in AI systems. The stock price fell by 39% that year in response, even as other semiconductor companies soared. I met with seasoned, supposedly expert analysts who told me the company was all but lost within the AI industry.
Yet eighteen months later, Samsung’s supposedly commodified memory chips were subject to extreme demand, due to changing patterns of supply brought on by rapid AI spending. Meanwhile, Samsung chipped away at the supposedly unassailable lead of one of its chief rivals at the high end of the memory market – Samsung may soon be the leading producer of high-bandwidth memory (“HBM”), which is critical for AI model performance. The stock not only recovered all its losses from 2024, but by June 30, 2026 had risen 269% higher, with a valuation hovering near $1 trillion. So much for the far-sighted analysts and investors.
I also see gross indiscipline in the “little details” of the market, the micro-mechanics of individual stock prices. The examples are too numerous to cite here. However, one of the most outrageous events occurred on June 2, 2026. In a public speech, Jensen Huang (CEO of Nvidia, a leading AI semiconductor producer and one of the world’s most valuable companies) stated that another company, Marvell Technology, would be the next company in the world to achieve a $1 trillion valuation. Whatever the merits of Mr. Huang’s claim (Marvell’s capitalization is nowhere near that level at present), the stock market’s subsequent reaction was unhinged: Marvell’s stock rose about 33% over the next day, ostensibly in response. Mr. Huang’s pronouncement “created” $62.4 billion in shareholder value. This change in the company’s stock price constituted the single largest one-day return for the past 26 years. I mean no disrespect to Mr. Huang, but no one can create such tremendous value merely by opening their mouth.2425 This event – one of many “micro” instances among AI-linked stocks – offers clear evidence that the market’s requisite discipline has been violated. For me at least, the market’s indiscipline is damning evidence of an acute bubble.26
Conclusion
In my experience, this is what a bubble looks like: highly uncertain (if not problematic) economics; extreme dependency on capital markets; fueled in the short run by wild valuation indiscipline that begets an inertia of its own. However, even as I have grown certain that bubble exists, I have no means of determining when and how it will collapse. I do know that the present circumstance is precarious, though.
As noted above, the economics of the AI industry are presently underpinned by massive capital expenditure, which in turn is incredibly dependent on capital markets for its sustenance. As such, this bubble will continue to inflate precisely so long as investors choose to fund it, and not a moment longer. Global capital markets are incredibly efficient at channeling capital from savers to those that would undertake expenditures, all at a tidy, risk-adjusted price. Yet the market’s ability to hold a stable equilibrium when under substantial strain – the kind of equilibrium where a $4.5 trillion gap can be funded on generous terms, where borrowers are able to defer or shift repayments of interest – is fragile. If investors begin to doubt the feasibility of that gap, the retraction will likely be swift and pronounced.
Amid this precarious set of conditions, I wish to emphasize that Seafarer is not attempting to delete all AI-related exposure from the Fund. We grasp the technology’s potential, and we continue to research companies and invest in stocks that should benefit from the propagation of artificial intelligence. We continue to discover plenty of positions that stand to directly or indirectly profit. Yet as we do so, we are not chasing exposure to the handful of stocks that have captivated markets, some of which appear to suffer from grossly inflated valuations.
You may assume having read the above that I am pessimistic about the outlook for markets. I am not! The bubble I have identified is an acute one, affecting AI stocks globally, but it is emphatically not a general one, affecting all stocks otherwise. Indeed, I am rather optimistic about stocks in the emerging markets apart from this acute AI bubble, as I find ample evidence that a broad-based earnings boom is underway. Earnings in the developing world are expected to grow over 60% in 2026.27 While AI-linked semiconductor and technology companies are the single biggest contributors to that growth rate, that growth rate is still expected to surpass 20% even if such companies are excluded from the estimate. Further, this is the third consecutive year of robust growth, as 2024 and 2025 saw substantial expansion in profits; while it’s early to rely on forecasts, initial estimates for 2027 suggest growth rates again in excess of 20% overall, and in excess of 10% excluding technology stocks.27 This boom characterized by sustained growth stands in sharp contrast to the preceding “lost decade” in the emerging markets, during which anemic earnings were mired in slow but steady currency losses.
Thank you for entrusting us with your capital. We are honored to serve as your investment adviser in the emerging markets.
with and- The performance data quoted represents past performance and does not guarantee future results. Future returns may be lower or higher. The investment return and principal value will fluctuate so that an investor’s shares, when redeemed, may be worth more or less than the original cost. View the Fund’s most recent month-end performance.
- The views and information discussed in this commentary are as of the date of publication, are subject to change, and may not reflect Seafarer’s current views. The views expressed represent an assessment of market conditions at a specific point in time, are opinions only and should not be relied upon as investment advice regarding a particular investment or markets in general. Such information does not constitute a recommendation to buy or sell specific securities or investment vehicles. It should not be assumed that any investment will be profitable or will equal the performance of the portfolios or any securities or any sectors mentioned herein. The subject matter contained herein has been derived from several sources believed to be reliable and accurate at the time of compilation. Seafarer does not accept any liability for losses either direct or consequential caused by the use of this information.
- As of June 30, 2026, securities mentioned in the portfolio review comprised the following weights in the Seafarer Overseas Growth and Income Fund: ALS, Ltd. (1.0%), Hyundai Mobis Co., Ltd. (3.6%), Samsung Electronics Co., Ltd., Pfd. (7.0%), Samsung Electronics Co., Ltd. (0.8%), Swire Pacific, Ltd. CL A (0.5%), and Swire Pacific, Ltd. CL B (0.1%). The Fund did not own shares in the other securities referenced in this portfolio review. View the Fund’s Top 10 Holdings. Holdings are subject to change.
- Sources: ALPS Fund Services, Inc. and Bloomberg.
- Source: Bloomberg Index Services Limited. BLOOMBERG® is a trademark and service mark of Bloomberg Finance L.P. and its affiliates (collectively “Bloomberg”). Bloomberg or Bloomberg’s licensors own all proprietary rights in the Bloomberg Indices. Neither Bloomberg nor Bloomberg’s licensors approves or endorses this material, or guarantees the accuracy or completeness of any information herein, or makes any warranty, express or implied, as to the results to be obtained therefrom and, to the maximum extent allowed by law, neither shall have any liability or responsibility for injury or damages arising in connection therewith.
- The Seafarer Funds are not sponsored, endorsed, sold, or promoted by Morningstar, Inc. Morningstar, Inc. makes no representation or warranty, express or implied, to the shareholders of the Funds or any member of the public regarding the advisability of investing in the Funds or the ability of the Morningstar Emerging Markets Net Return U.S. Dollar Index to track general equity market performance of emerging markets.
- References to the “Fund” pertain to the Fund’s Institutional share class (ticker: SIGIX). The Investor share class (ticker: SFGIX) returned 13.42% during the quarter. The Retail share class (ticker: SFGRX) returned 13.33% during the quarter. All returns are measured inclusive of Fund distributions paid (in relation to Fund performance) or dividends paid (in relation to index performance), reinvested in full (exclusive of any U.S. taxation) on the pertinent ex-date.
- The performance data quoted represents past performance and does not guarantee future results. Future returns may be lower or higher. The investment return and principal value will fluctuate so that an investor’s shares, when redeemed, may be worth more or less than the original cost. View the Fund’s most recent month-end performance.
- The inception date of the Fund’s Institutional Class is February 15, 2012.
- The Fund’s Investor share class began the quarter with a net asset value of $15.21 per share; it paid a semi-annual distribution of approximately $0.479 per share during the quarter; and it finished the quarter with a value of $16.77 per share. The Fund’s Retail share class began the quarter with a net asset value of $15.19 per share; it paid a semi-annual distribution of approximately $0.473 per share during the quarter; and it finished the quarter with a value of $16.74 per share.
- The Fund’s best two quarters occurred in the second and fourth quarters of 2020 (second best and best, respectively), in the wild and whipsaw trading conditions that accompanied the global Covid pandemic. Indeed, the worst quarter in the Fund’s history was the first quarter of 2020.
- Bloomberg Emerging Markets Large, Mid, and Small Cap Net Return USD Index, as of 6/30/26. Combined weighting includes a 0.6% weighting in Samsung Electronics’ preferred shares.
- iShares Core MSCI Emerging Markets ETF (ticker: IEMG), as of 6/30/26. Combined weighting includes a 0.8% weighting in Samsung Electronics’ preferred shares.
- Bloomberg News, “Funds Fret Over $4.4 Trillion AI Trio’s Grip on Emerging Markets,” 7/13/26, in reference to the MSCI Emerging Markets Index.
- relative to what the exposure would have been at the end of the second quarter of 2026 had no action been taken. For the purpose of clarity, the Fund’s allocative weighting to South Korea was 18% at both March 31, 2026 and June 30, 2026.
- Cleary Gottlieb, “Alphabet in Upsized $90 Billion Equity Offerings,” 6/4/26; Bloomberg News, “AI Bond Binge Enters New Era of Weak Demand and Sky-High Costs,” 7/28/26.
- Bloomberg News, “Goldman Pitches $5.4 Billion Debt for Microsoft-Tied Data Center,” 7/29/26.
- Bloomberg News, “AI Bond Binge Enters New Era of Weak Demand and Sky-High Costs,” 7/28/26.
- J.P. Morgan, “AI Capex 2.0: If You Build It, They Will Finance It,” 6/17/26, pg. 4.
- Bloomberg News, “AI Bumps Power Cost 60% as Mega U.S. Grid Fails to Hit Supply Goal,” 7/14/26.
- Yale Clean Energy Forum, “Data Centers Want Power. Regulators Say Wait,” 11/12/25.
- Prince William Times, “Power crunch keeps data centers in the dark,” 7/15/26.
- Bloomberg News, “McKinsey CFO Has a Warning on AI Costs: CFO Briefing,” 8/9/26.
- Bloomberg News, “Meta Plans to Crack Down on Employee Token Use,” 6/12/26; citing Jyoti Mann, The Information, “Tokenminimizing: Meta Moves to Curb Employee AI Usage as AI Costs Reach Billions.”
- The Economist, “AI revenues are growing fast, but not fast enough,” 7/28/26.
- Dario Amodei, CEO of Anthropic, has stated that the generative AI industry will form a stable oligopoly of “between three and six players … capable of building frontier models and [with sufficient access to] capital to plausibly bootstrap themselves.” Cheeky Pint Podcast, “A Cheeky Pint with Anthropic CEO Dario Amodei,” 8/6/25.
- Leopold Aschenbrenner, Chief Investment Officer of Situational Awareness, L.P. has written that "a lead of mere months could be decisive: months could mean the difference between roughly human-level AI systems and substantially superhuman AI systems," and that “superintelligences alone … would be enough for a decisive advantage” over pre-superintelligence AI systems. Aschenbrenner, Leopold, "IIId. The Free World Must Prevail," Situational Awareness: The Decade Ahead.
- Bloomberg News, “Meta’s Zuckerberg Defends AI Bets to Skeptical Investors,” 7/29/26.
- More formally, I believe in a variant of the “semi-strong” form of the Efficient Market Hypothesis (EMH). In the semi-strong form of an efficient market, current stock prices reflect all publicly known and available information (including historical price trends). My own variant acknowledges that market participants have sufficient access and skill to digest such information in stock prices immediately, at least with respect to information that can be known or reasonably foreseen over the next one to two years. However, I believe that information pertinent to longer-term horizons is difficult to access and to assess; fewer market participants might feasibly acquire and correctly analyze such long-term information. These investors may be too few and too small in scale to ensure markets are always and everywhere priced efficiently. Thus, my “semi-strong” variant suggests that while the market may ensure prices reflect all that is known or knowable over the next two years or so, the market might routinely misprice information pertinent to longer-term horizons (e.g. three years and beyond).
- On 6/1/26, the day prior to Mr. Huang’s pronouncement, Marvell Technology’s stock closed the day with a price of $219.38 per share. On 6/2/26, after Mr. Huang’s pronouncement, Marvell’s stock closed at $290.72 per share, representing a gain of $71.34 per share, and a 32.5% return over 24 hours. Marvell has approximately 874.8 million shares outstanding. Given a gain of $71.34 per share, Mr. Huang’s pronouncement “created” $62.4 billion in shareholder value.
- The Beatles, Frank Sinatra, David Bowie, Dolly Parton, Bob Dylan, John Prine and the Boss have all created incredible value by opening their mouths … but not even they can manage $62.4 billion in one go.
- Adding to the woes of even semi-strong efficient market adherents: the market should have known (or at least discounted the probability) of prospective shareholder value creation due to strategic interaction between Nvidia and Marvell, as it was public knowledge that the former purchased a $2 billion stake in the latter several months prior. If Marvell’s worth is to be bolstered by substantial interactions with Nvidia, investors should have awarded a higher price to the stock at the time of that transaction, such that Mr. Huang’s June pronouncement would have little or no discernible effect. Further, Marvell’s stock price ostensibly “trended” even higher on “momentum” over the ensuing two days (this sort of evident “momentum” is another violation of market efficiency). The stock attained a price of $315.35 on 6/4/26. As I write in early August, that price proved to be Marvell’s ultimate peak; the stock has since declined to a price lower ($211) than where it was before Mr. Huang opened his mouth ($219).
- J.P. Morgan, “Emerging Markets Equity Strategy,” July 2026.
![[Chrome]](/_layout/images/ua/chrome.png)
![[Firefox]](/_layout/images/ua/firefox.png)
![[Opera]](/_layout/images/ua/opera.png)
![[Microsoft Edge]](/_layout/images/ua/edge.png)